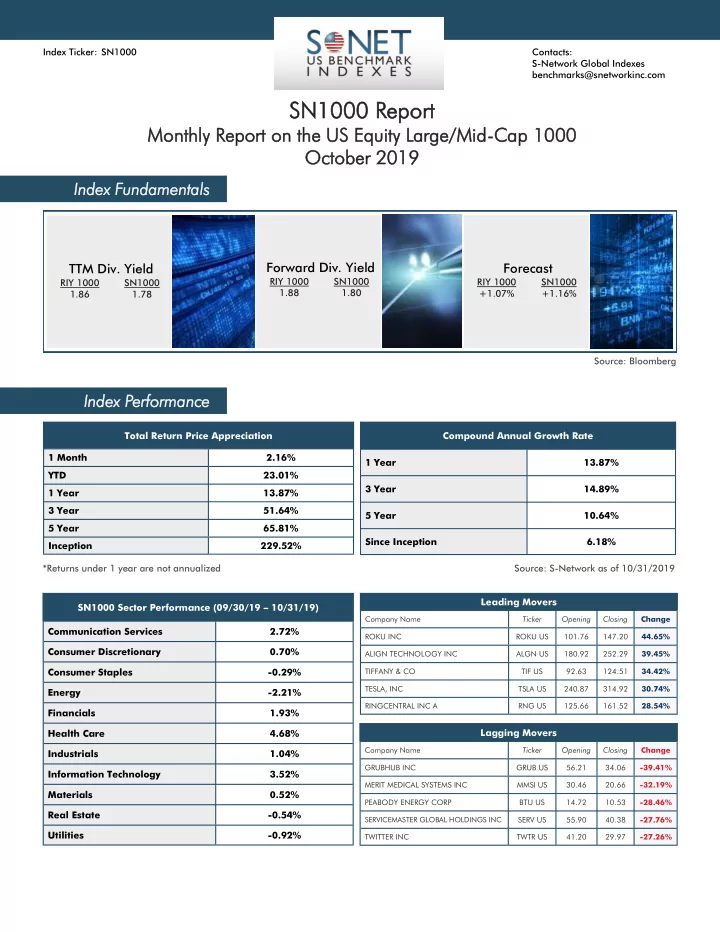

Index Ticker: SN1000 Contacts: S-Network Global Indexes benchmarks@snetworkinc.com SN SN1000 000 Rep eport ort Month nthly R Repor eport t on on th the e US S Equity Equity L Larg arge/Mi e/Mid-Cap Cap 10 1000 00 Octob ctober 20 er 2019 19 In Index F ex Fun undament entals ls Forward Div. Yield TTM Div. Yield Forecast RIY 1000 SN1000 RIY 1000 SN1000 RIY 1000 SN1000 1.88 1.80 1.86 1.78 +1.07% +1.16% Source: Bloomberg In Index P ex Perfor rformanc nce Total Return Price Appreciation Compound Annual Growth Rate 1 Month 2.16% 1 Year 13.87% YTD 23.01% 3 Year 14.89% 1 Year 13.87% 3 Year 51.64% 5 Year 10.64% 5 Year 65.81% Since Inception 6.18% Inception 229.52% *Returns under 1 year are not annualized Source: S-Network as of 10/31/2019 Leading Movers SN1000 Sector Performance (09/30/19 – 10/31/19) Company Name Ticker Opening Closing Change Communication Services 2.72% ROKU INC ROKU US 101.76 147.20 44.65% Consumer Discretionary 0.70% ALIGN TECHNOLOGY INC ALGN US 180.92 252.29 39.45% Consumer Staples -0.29% TIFFANY & CO TIF US 92.63 124.51 34.42% TESLA, INC TSLA US 240.87 314.92 30.74% Energy -2.21% RINGCENTRAL INC A RNG US 125.66 161.52 28.54% Financials 1.93% Lagging Movers Health Care 4.68% Company Name Ticker Opening Closing Change Industrials 1.04% GRUBHUB INC GRUB US 56.21 34.06 -39.41% Information Technology 3.52% MERIT MEDICAL SYSTEMS INC MMSI US 30.46 20.66 -32.19% Materials 0.52% PEABODY ENERGY CORP BTU US 14.72 10.53 -28.46% Real Estate -0.54% SERVICEMASTER GLOBAL HOLDINGS INC SERV US 55.90 40.38 -27.76% Utilities -0.92% TWITTER INC TWTR US 41.20 29.97 -27.26%
Com Company ny Reports orts Communication Services: Alphabet Inc's revenues increased +20.0% for the quarter ended September 2019 to $40.50 billion from $33.74 billion a year Quick Link 1 earlier, while net income fell -23.1% to $7.07 billion from $9.19 billion. AT&T Inc's revenues decreased -2.5% for the quarter ended September 2019 to $44.59 billion from $45.74 billion a year Quick Link 2 earlier, while net income fell -23.2% to $3.70 billion from $4.82 billion. Verizon Communications Inc's revenues increased +0.9% for the quarter ended September 2019 to $32.89 billion from $32.61 Quick Link 3 billion a year earlier, while net income rose +5.5% to $5.19 billion from $4.92 billion. Comcast Corp's revenues increased +21.2% for the quarter ended September 2019 to $26.83 billion from $22.14 billion a Quick Link 4 year earlier, while net income rose +13.4% to $3.29 billion from $2.90 billion. Netflix Inc's revenues increased +31.0% for the quarter ended September 2019 to $5.24 billion from $4.00 billion a year Quick Link 5 earlier, while net income rose +65.1% to $665.2 million from $402.8 million. Charter Communications Inc's revenues increased +5.1% for the quarter ended September 2019 to $11.45 billion from $10.89 Quick Link 6 billion a year earlier, while net income fell -21.5% to $387.0 million from $493.0 million. Consumer Discretionary: Amazon.com Inc's net sales increased +23.7% for the quarter ended September 2019 to $69.98 billion from $56.58 billion a Quick Link 7 year earlier, while net income fell -26.0% to $2.13 billion from $2.88 billion. McDonald's Corp's revenues increased +1.1% for the quarter ended September 2019 to $5.43 billion from $5.37 billion a year Quick Link 8 earlier, while net income fell -1.8% to $1.61 billion from $1.64 billion. Consumer Staples: Procter & Gamble Co's net sales increased +6.7% for the quarter ended September 2019 to $17.80 billion from $16.69 billion Quick Link 9 a year earlier, while net earnings rose +12.2% to $3.59 billion from $3.20 billion. The Coca-Cola Co's revenues increased +8.3% for the quarter ended September 2019 to $9.51 billion from $8.78 billion a Quick Link 10 year earlier, while net income rose +37.8% to $2.59 billion from $1.88 billion. PepsiCo Inc's revenues increased +4.2% for the quarter ended August 2019 to $17.19 billion from $16.49 billion a year earlier, while net income fell -16.0% to $2.10 billion from $2.50 billion. Quick Link 11 Costco Wholesale Corp's net sales increased +7.9% for the year ended August 2019 to $152.70 billion from $141.58 billion a Quick Link 12 year earlier, while net income rose +16.9% to $3.66 billion from $3.13 billion. Philip Morris International Inc's revenues increased +1.9% for the quarter ended September 2019 to $7.64 billion from $7.50 Quick Link 13 billion a year earlier, while net income fell -11.7% to $2.79 billion from $3.16 billion. Mondelez International Inc's revenues increased +1.1% for the quarter ended September 2019 to $6.36 billion from $6.29 Quick Link 14 billion a year earlier, while net earnings rose +19.3% to $1.42 billion from $1.19 billion. Energy: ConocoPhillips's revenues decreased -0.8% for the quarter ended September 2019 to $10.09 billion from $10.17 billion a year Quick Link 15 earlier, while net income rose +64.5% to $3.06 billion from $1.86 billion. Financials: JPMorgan Chase & Co's revenues increased +8.1% for the quarter ended September 2019 to $30.06 billion from $27.82 Quick Link 16 billion a year earlier, while net income rose +8.4% to $9.08 billion from $8.38 billion. Bank of America Corp's revenues increased +0.4% for the quarter ended September 2019 to $22.80 billion from $22.70 billion Quick Link 17 a year earlier, while net income fell -19.4% to $5.80 billion from $7.20 billion. Wells Fargo & Co's net sales increased +0.9% for the quarter ended September 2019 to $16.50 billion from $16.36 billion a Quick Link 18 year earlier, while net income fell -25.9% to $4.04 billion from $5.45 billion. Citigroup Inc's revenues increased +1.0% for the quarter ended September 2019 to $18.57 billion from $18.39 billion a year Quick Link 19 earlier, while net income rose +6.3% to $4.91 billion from $4.62 billion. Continued on back
Recommend
More recommend