
SLIDE 1
Inglewood Transit-Oriented Development Plans
Downtown Inglewood ▪ Fairview Heights ▪ Westchester/Veterans ▪ Crenshaw/Imperial
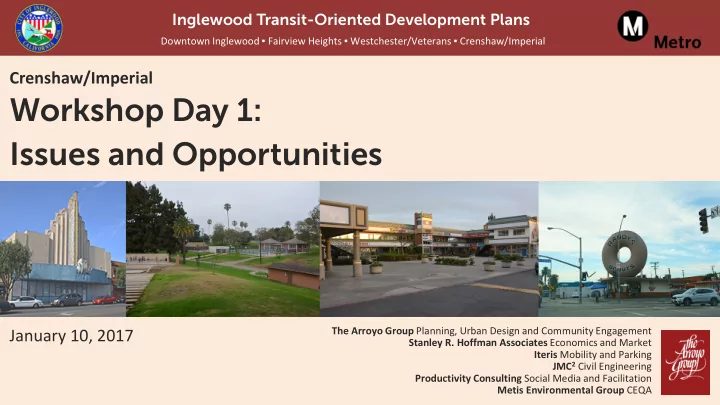
Crenshaw/Imperial
Workshop Day 1: Issues and Opportunities
The Arroyo Group Planning, Urban Design and Community Engagement Stanley R. Hoffman Associates Economics and Market Iteris Mobility and Parking JMC2 Civil Engineering Productivity Consulting Social Media and Facilitation Metis Environmental Group CEQA
January 10, 2017