SLIDE 1
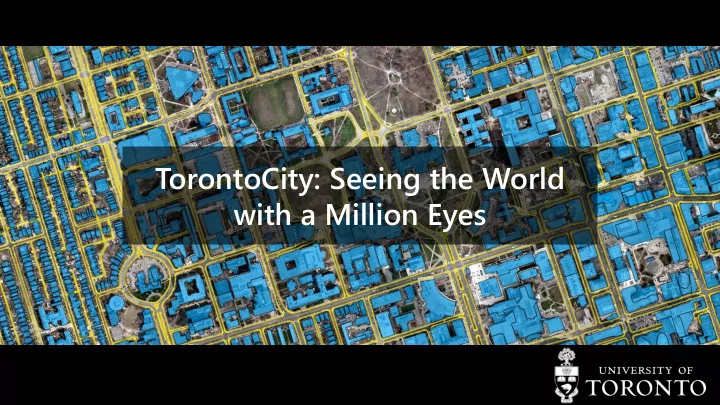
TorontoCity: Seeing the World with a Million Eyes
SLIDE 2 Authors
Shenlong Wang, Min Bai, Gellert Mattyus, Hang Chu, Wenjie Luo, Bin Yang Justin Liang, Joel Cheverie, Sanja Fidler, Raquel Urtasun
* Project Completed by Summer 2016
SLIDE 3 Why Toronto?
The best place to live in the world*
*According to 2015 Global Liveability Ranking
SLIDE 4 Why Toronto?
The best place to live in the world*
The places you are working at:
- Boston 36
- Pittsburgh 39
- San Francisco 49
- Los Angeles 51
*According to 2015 Global Liveability Ranking
SLIDE 5
A dataset over 700 km2 region!
SLIDE 6
From all the views!
SLIDE 7
Dataset
Aerial Data Source
SLIDE 8
Dataset
Aerial Ground Level Panorama Data Source
SLIDE 9
Dataset
Aerial LIDAR Data Source Ground Level Panorama
SLIDE 10
Dataset
Aerial LIDAR Stereo Data Source Ground Level Panorama
SLIDE 11
Dataset
Aerial LIDAR Stereo Drone Data Source Ground Level Panorama
SLIDE 12
Dataset
Aerial Airborne LIDAR Data Source Ground Level Panorama LIDAR Stereo Drone
SLIDE 13 Why we need this?
- Mapping for Autonomous Driving
- Smart City
- Benchmarking:
- Large-Scale Machine Learning / Deep Learning
- 3D Vision
- Remote Sensing
- Robotics
Source: Here 360
SLIDE 14 Why we need this?
- Mapping for Autonomous Driving
- Smart City
- Benchmarking:
- Large-Scale Machine Learning / Deep Learning
- 3D Vision
- Remote Sensing
- Robotics
Source: Toronto SmartCity Summit
SLIDE 15 Why we need this?
- Mapping for Autonomous Driving
- Smart City
- Benchmarking:
- Large-Scale Machine Learning / Deep Learning
- 3D Vision
- Remote Sensing
- Robotics
SLIDE 16 Annotations
- Manual annotation? Impossible!
- Suppose each 500x500 image costs $1 to annotate pixel-wise
labels, we need to pay $11M to create ground-truth only for the aerial images.
SLIDE 17 Annotations
- Manual annotation? Impossible!
- Suppose each 500x500 image costs $1 to annotate pixel-wise
labels, we need to pay $11M to create ground-truth only for the aerial images.
I’m not as rich as Jensen
SLIDE 18 Annotations
- Manual annotation? Impossible!
- Suppose each 500x500 image costs $1 to annotate pixel-wise
labels, we need to pay $11M to create ground-truth only for the aerial images.
- However, humans already collect rich knowledge about
the world!
I’m not as rich as Jensen
SLIDE 19 Annotations
- Manual annotation? Impossible!
- Suppose each 500x500 image costs $1 to annotate pixel-wise
labels, we need to pay $1139200 to create ground-truth only for the aerial images.
- Humans already collect rich knowledge about the world!
Use maps!
I’m not as rich as Jensen
SLIDE 20
Map as Annotations
HD Map
Maps
SLIDE 21
Map as Annotations
3D Building HD Map
Maps
SLIDE 22
Map as Annotations
3D Building HD Map Meta Data
Maps
SLIDE 23
Together, the rich sources of data enable a plethora of exciting tasks!
SLIDE 24
Building Footprint Extraction
SLIDE 25
Road Curb and Centerline Extraction
SLIDE 26
Building Instance Segmentation
SLIDE 27
Zoning Prediction
Institutional Residential Commercial
SLIDE 28
Technical Difficulties
Mis-alignment and Data Noise
Aerial-ground images mis-alignment from raw GPS location data Road centerline is shifted Building’s shape/location is not accurate
SLIDE 29
Data Pre-processing and Alignment
Appearance based Ground-aerial Alignment
Before Alignment After Alignment
SLIDE 30
Data Pre-processing and Alignment
Instance-wise Aerial-map Alignment
Before alignment
SLIDE 31
Data Pre-processing and Alignment
Instance-wise Aerial-map Alignment
After alignment
SLIDE 32
Data Pre-processing and Alignment
Robust Road Surface Generation
Input Road Curb and Centreline (Noisy) Polygonized Road Surface
SLIDE 33
Pilot Study with Neural Networks
Building Contour and Road Curb/Centerline Extraction
GT ResNet
SLIDE 34
Pilot Study with Neural Networks
Semantic Segmentation Method Road Building Mean FCN 74.94% 73.88% 74.41% ResNet-56 82.72% 78.80% 80.76% Metric: Intersection-over-union (IOU), higher is better
SLIDE 35
Pilot Study with Neural Networks
Building Instance Segmentation
Input DWT
SLIDE 36
Pilot Study with Neural Networks
Building Instance Segmentation Metric: Weighted Coverage, AP , Precision-50%, Recall-50%, higher is better Method Weighted Coverage Average Precision Recall-50% Precision-50% FCN 41.92% 11.37% 21.50% 36.00% ResNet-56 40.65% 12.13% 18.90% 45.36% Deep Watershed Transform 56.22% 21.22% 67.16% 63.67%
SLIDE 37
Pilot Study with Neural Networks
Building Instance Segmentation Join the other talk today to know more about the deep watershed instance segmentation: Wednesday, May 10, 4:00 PM - 4:25 PM – Room 210G Method Weighted Coverage Average Precision Recall-50% Precision-50% FCN 41.92% 11.37% 21.50% 36.00% ResNet-56 40.65% 12.13% 18.90% 45.36% Deep Watershed Transform 56.22% 21.22% 67.16% 63.67%
SLIDE 38
Pilot Study with Neural Networks
Ground-view Road Segmentation True Positive: Yellow; False Negative: Green; False Positive: Red
SLIDE 39
Pilot Study with Neural Networks
Ground-view Road Segmentation Metric: Intersection-over-Union, higher is better Method Non-Road IOU Road IOU Mean IOU FCN 97.3% 95.8% 96.5% ResNet-56 97.8% 96.6% 97.2%
SLIDE 40
Pilot Study with Neural Networks
Ground-view Zoning Classification Top-1 Accuracy Method From-Scratch Pre-trained from ImageNet AlexNet 66.48% 75.49 GoogLeNet 75.08% 77.95% ResNet 75.65% 79.33% Metric: Top-1 Accuracy, higher is better
SLIDE 41
- # of buildings: 397846
- Total area: 712.5 km2
- Total length of road: 8439 km
Statistics
SLIDE 42 Building height distribution Zoning type distribution
Statistics
SLIDE 43 Conclusion
- We propose a large dataset with from different views and sensors
- Maps are used to create GT annotations
- In future we have many more exciting tasks to come
- Check our paper for more details: https://arxiv.org/abs/1612.00423
- Data available soon. Stay tuned and welcome to over-fit
Join the other talk today to know more about the deep watershed instance segmentation: Wednesday, May 10, 4:00 PM - 4:25 PM – Room 210G