
SLIDE 1
TBG102611183900MKE
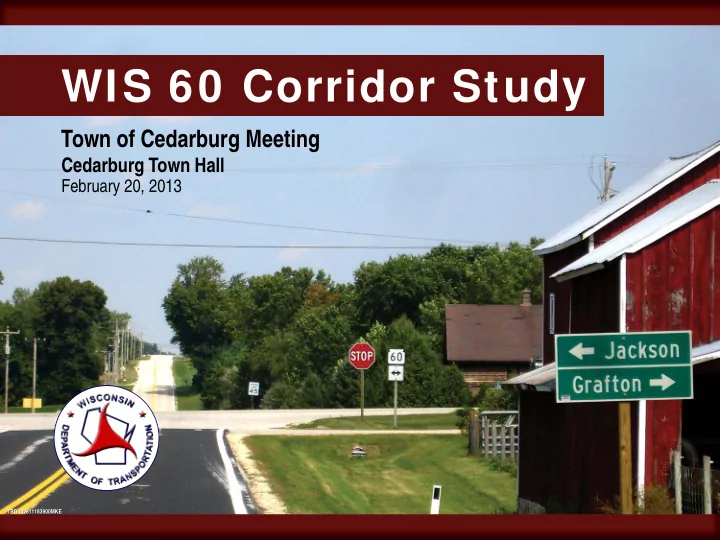
WIS 60 Corridor Study
Town of Cedarburg Meeting
Cedarburg Town Hall
February 20, 2013
WIS 60 Corridor Study Town of Cedarburg Meeting Cedarburg Town Hall - - PowerPoint PPT Presentation
WIS 60 Corridor Study Town of Cedarburg Meeting Cedarburg Town Hall February 20, 2013 TBG102611183900MKE Meeting Purpose Allow Town to expand on comments provided after PIM No.1 Understand Towns future vision for WIS 60 Importance
TBG102611183900MKE
Cedarburg Town Hall
February 20, 2013
2
Allow Town to expand on comments provided after PIM No.1 Understand Town’s future vision for WIS 60 Importance of WIS 60 to state trunk highway system Explain issues of public concern at PIM No.1
― Crash rates ― Level of service ― 2040 traffic projections ― Appropriate posted speeds on WIS 60
Describe engineering constraints that guide design Obtain your reaction to refined alternative concepts
3
Town Resolution (8-1-12)
― Opposed to preliminary alts. especially bypasses and excessive R/W ― Use current alignment and center improvements on current R/W ― Separate design for Five Corners and area east and west of it because of
differences in traffic patterns and accidents
― Redesign County Y intersection immediately and add RAB or signal
Town Administrator letter (7-13-12)
― Eliminate huge median, clear zone and multi-use path ― Consider reducing posted speed to limit new R/W needed
City Resolution (9-10-12)
― Opposed to Five Corners bypasses (improvements along existing alignment) ― Reduce speed to 45 mph and minimize impacts to private property
4
Ozaukee County (12-5-12)
― Opposes WisDOT’s preliminary alternatives, including the bypass options and
excessive right-of-way expansion
― Recommends using the current alignment ― Work with the local governments to establish an acceptable right-of-way
5
6
This is a working meeting, ask questions at any time The intent of today’s meeting is not to present information about
The alternatives discussed today are not intended to respond to all
Your input today will help us make more informed decisions about
7
Introductions Importance of WIS 60 Frequently asked questions at PIM No.1
― Results of WIS 60 speed study ― How are crash rates developed? ― How is level of service determined? ― How were the 2040 traffic volumes developed?
Refined alternative concepts What’s Next?
8
Long truck route connecting I-43 to US 45 and US 41 Route on state’s highway freight network Provides access to industrial parks in Grafton, Cedarburg, Jackson
Important arterial for growing population in study area Spans width of state
9
10
WI State Statute 346.57(4) establishes speed
Traffic speed data was collected in the Town of
Wisconsin Statewide Speed Management
11
Four locations evaluated
― Lizbeth Lane ― 0.35 mile east of Horns Corners Road ― Hilltop Drive ― Midway Between Keup Road and 1st Avenue
Posted Speed
― 55 mph at Lizbeth Lane and east of Horns Corners Road ― 45 mph at Hilltop Drive and between Keup Road and 1st Avenue
12
13
Location Direction Posted Speed Limit (mph) Percentile Speed (MPH) 10 MPH Pace Speed 15th 50th 85th 95th Lizbeth Lane EB 55 52 56 60 62 52 - 61 WB 55 52 57 60 63 52 - 61 0.35 Mile East of Horns Corners Road EB 55 50 55 59 60 51 - 60 WB 55 50 55 58 61 50 - 59 Hilltop Drive EB 45 46 49 51 55 43 -52 WB 45 44 48 52 55 43 - 52 Midway between Keup Road and 1st Avenue EB 45 39 43 47 50 38 - 47 WB 45 39 44 48 51 38 -47 Percentile Speeds: The speed at or below which a certain percentage of observed traffic travels
14
15
Crash Rates Segment Fatal Injury A Injury B Injury C Property Damage Only Total Jackson (US 45 to Eagle Drive) 0.0
16.4
27.3 41.0
215.8 300
Rural (Eagle Drive to County Line)
3.3 6.5 24.4 16.3 52.0 102
Rural (County Line to Five Corners)
2.2 6.7 11.1 13.4 44.6 78
Town of Cedarburg (Five Corners to Keup) 0.0 2.5 13.8 17.3 59.2 99 Grafton (Keup to 11th Avenue) 0.0 6.97 17.4 66.2 146.3 236.8 Bold values are above the statewide average. Statewide Average Rates 2006–2010 Small urban (Village of Jackson) 0.6 7.8 30.0 44.5 165.4 244 Rural highways with more than 3500, but less than 8700 ADT (Eagle Drive to Five Corners) 1.3 5.3 10.6 11.0 41.7 70 Large urban undivided highways (Town of Cedarburg ) 1.4 10.1 37.4 74.4 219.9 343 Urban streetsa (Village of Grafton) 0.62 6.26 28.2 51.8 204.4 291.4
Note: Rates are in 100 million vehicle miles traveled.
aAverage of 5 years.
16
Crash Severity (excluding deer crashes) WIS 60 Segment Fatal Injury A Injury B Injury C Property Damage Only Total Jackson (US 45 to Eagle Drive) 6 10 15 79 110 Rural (Eagle Drive to County Line) 2 4 15 10 32 63 Rural (County Line to Five Corners) 1 3 5 6 20 35 Five Corners 3 6 8 25 42 Town of Cedarburg (Five Corners to Keup) 1 8 7 24 40 Grafton (Keup to 11th Avenue) 2 5 19 42 68
Total 3 19 49 65 222 358
0.8% 5.3% 13.6% 18.1% 62.1% Type of Crash: WIS 60 (Jackson to Grafton) Segment Angle Rear-end Sideswipe Head-on Fixed Object / Off Road Deer Total Same Direction Opposite Direction Jackson (US 45 to Eagle Drive) 24 62 6 2 16 110 Rural (Eagle Drive to County Line) 19 13 6 3 1 21 30 93 Rural (County Line to Five Corners) 12 9 4 1 9 24 59 Five Corners 25 9 3 1 4 42 Town of Cedarburg (Five Corners to Keup) 5 20 1 1 1 12 4 44 Grafton (Keup to 11th Avenue) 30 19 6 1 12 4 72
Total 115 132 26 6 5 74 62 420
27.9% 31.3% 6.1% 1.5% 1.2% 17.0% 15.0%
17
Property Damage Only Injury A – Incapacitating Injury Injury B – Non-incapacitating Injury Injury C – Possible Injury Fatal
18
One-mile segment with 10,000 vehicles per day and
Two-mile segment with 25,000 vehicles per day and
Just counting the number of crashes does not give a good
19
The crash rate expresses the safety of a road segment in terms of
Crashes 100 Million Vehicle Miles
Crash Rate = Crash Rate =
Number of Crashes * 100,000,000
365*Years*Average Daily Traffic*Length 365 days per year Years in the study period (5 years) Average daily traffic (vehicles/day) Length of road segment (miles)
20
One-mile segment with 10,000 vehicles per day and 5 crashes
Two-mile segment with 25,000 vehicles per day and 9 crashes
21
22
23
Historic Traffic Growth Land Use trends Traffic Impact Analyses for Development
– Five Corners – Cedarburg Business Park – Grafton West Subdivision
Roadway Segment Existing Traffic 2010 AADT (vpd) Future Traffic 2040 AADT (vpd) Percent Increase County Y to Five Corners 8,600 14,900 73 Five Corners–County I 13,800 24,000 74 County I–Keup Road 14,900 24,700 66
24
25
Traffic operations are expressed in terms of Level of Service The Level of Service is evaluated using the Highway Capacity
Level of Service is evaluated for intersection operation and for
26
Urban segment LOS is given in terms of average travel speed Rural two-lane segment LOS is given in terms of percent time
Intersection LOS is given in terms of average seconds of delay
Intersection LOS is described using an A-F scale with LOS A the
Source: Florida DOT Quality of Service Handbook, 2002
27
Existing and Design Year (Year 2040) Segment Level of Service for No Build Alternative
Existing (2011 PM Peak) Design Year (2040 PM Peak) Highway Segment Average Travel Speed LOS Numeric Value Average Travel Speed LOS Numeric Value County P to Industrial 7.4 E 5.80 2.8 F 6.60 Industrial to Eagle Drive 17.0 C 3.33 6.9 F 6.02 Eagle Drive to County Line 40.4 D 4.91 36.3 E 5.19 County Line to WIS 181 37.9 E 5.10 33.1 E 5.35 WIS 181 to Keup Road 24.3 C 3.62 9.3 F 6.28 Keup Road to 11th Avenue 13.5 C 3.92 5.9 F 6.16
28
29
Roadway Feature What is it? Typical Dimension Why is it important? Travel Lane Portion of roadway marked to guide drivers 12’
30
Roadway Feature What is it? Typical Dimension Why is it important? Shoulder Additional paved and unpaved roadway width adjacent to travel lane Inside: 4’ – 6’ Outside: 10’
31
Roadway Feature What is it? Typical Dimension Why is it important? Median Portion of the highway separating
ditched or raised (with curb & gutter). For high speed roadways: 30’ minimum (raised) 50’ desirable (ditched)
32
Median is required with 4-lanes and posted speed above 40 mph Advantages and disadvantages of 30' median vs. 50' median:
Roadway Cross Section Advantages Disadvantages 30’ Median
50’ Median
33
PASSENGER CAR
vehicle length = 19’
50’ median
30’ median
INTERMEDIATE SEMITRAILER (WB-50)
vehicle length = 55’
Note: turning radii are referenced to center of vehicle path
SINGLE UNIT TRUCK (SU)
vehicle length = 30’
30’ median
50’ median 50’ median
30’ median
34
PASSENGER CAR WITH TRAILER
total vehicle length = 49’
30’ median
COMBINE
vehicle length = 33.5’
50’ median
CONVENTIONAL SCHOOL BUS
vehicle length = 36’
30’ median
50’ median
30’ median
50’ median
Note: turning radii are referenced to center of vehicle path
35
Roadway Feature What is it? Typical Dimension When and why is it used? TWLTL (two-way left turn lane) Provides center lane for deceleration and storage of left-turning vehicles. A TWLTL is considered a median but is referred to as a flush median. Low to moderate speeds: 14’ – 16’
36
4-lane divided roadway 5-lane roadway with TWLTL (not allowed on high speed roadways)
Roadway Cross Section Advantages Disadvantages 4-lane divided
side roads
5-lane TWLTL
approaches)
37
Roadway Feature What is it? Typical Dimension Why is it important? Clear Zone Roadside area adjacent to outside travel lane, free from obstacles and steep slopes 20’ (at 45 mph) 26’ to 32’ (at 55 mph)
38
Roadway Feature What is it? Typical Dimension Why is it important? Grading and Sloping Width A distance outside the roadway clear zone or shared-use path Varies
39
“Complete Streets” policy
― Federal policy requiring bicycle and pedestrian accommodations on new
construction and reconstruction projects
― WisDOT policy, State Statutes, and Administrative Code follow federal policy ― DOT has responsibility to improve conditions and opportunities for walking and
bicycling
Ped/Bike Accommodation Alternatives
― Shared-use path accommodates bicyclists and pedestrians ― Sidewalk accommodates pedestrians ― Paved shoulder can accommodate bicyclists; younger and casual bicyclists
generally prefer shared-use paths
40
Conceptual alternatives depicted to get initial community input
― Roadway lines shown to better represent roadway layout ― Intersection concepts developed
Reduced corridor width / proposed right of way
― Corridor width includes most ditching/sloping outside of roadway ― Minor grading/sloping may be needed beyond corridor width
Approach for designating displacements
― Displacements occur when the proposed corridor width touches a building ― Additional impacts may occur due to the proximity of the roadway to various features
41
4-lane divided highway alternatives
― 30’ and 50’ median alternatives
Roadway alignment
― Currently shown to widen straight down the center of WIS 60 ― Alignment will be refined to further minimize impacts
Bicycle and pedestrian accommodations
― Sidewalk included for pedestrians ― Bicycles to use paved shoulder ― Shared use path included on north side east of Horns Corners Rd
Intersection concepts
― County Y
42
4-lane divided highway alternative with 30’ median Developed overlay for 5-lane TWLTL alternative Roadway alignment
― Currently shown to generally widen straight down the center of WIS 60; alignment
will be refined to further minimize impacts
― East of County I, widening center impacts south side; widen north reduces impacts
Bicycle and pedestrian accommodations
― Sidewalk and shared used path included for pedestrians ― Bicycles can use shared use path or paved shoulder
Intersection concepts
― County I, Keup Rd ― Five Corners, WIS 181/Sycamore Dr
43
44
2009 feasibility study to evaluate a
WisDOT project began in 2010, TIA prepared 4-legged intersection compared to 5-legged
5-legged roundabout presented at public
Incorporated in WIS 60 study to insure compatibility of
45
Inefficient operations
― The fifth leg runs by itself so the other four legs are delayed. At a four leg
intersection complementary movements go through at the same time.
Safety
― With five legs there are turn movements where there is more than one place to turn
vehicle is going. This leads to confusion that results in crashes.
46
Four leg signalized intersection with Covered Bridge Road
Five leg roundabout Four leg roundabout with Covered Bridge Road relocated
47
Complete community meetings in February Develop reasonable range of alternatives Hold PAC Meeting No.3 – Spring Local officials meeting – Spring Conduct Public Information Meeting No.2 – Summer