
SLIDE 1
9/8/2012 1
Utility of cardiac MRI for identifying the Arrhythmia Substrate during VT ablation
Timm Dickfeld, MD, PhD
Director of Electrophysiology, VA Baltimore Associate Professor of Medicine, University of Maryland MACIG (Maryland Arrhythmia and Cardiac Imaging Group) www.umm.edu/heart/macig
Disclosure-of-Relationship
- Research Grants, Consulting –
Biosense-Webster
Unlabeled Indications
- Use of Gadolinium for MRI Scar Imaging
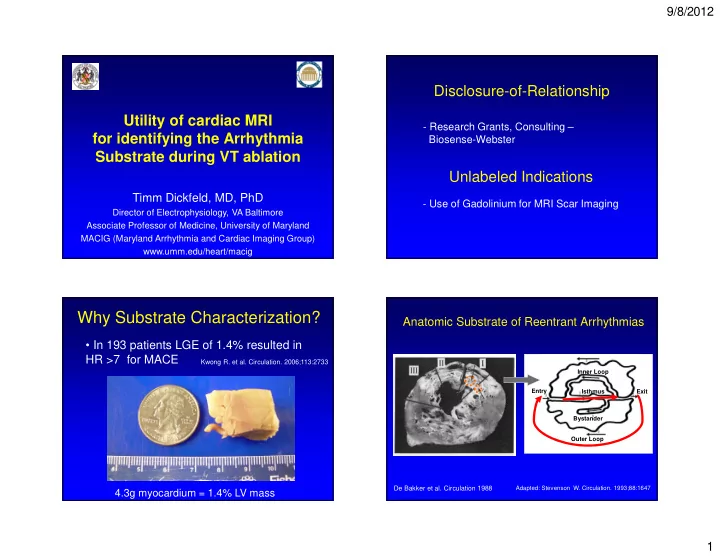
Why Substrate Characterization?
4.3g myocardium = 1.4% LV mass
- In 193 patients LGE of 1.4% resulted in
HR >7 for MACE
Kwong R. et al. Circulation. 2006;113:2733
Anatomic Substrate of Reentrant Arrhythmias
De Bakker et al. Circulation 1988
Adapted: Stevenson W. Circulation. 1993;88:1647 Inner Loop Outer Loop Bystander Exit Isthmus Entry