Where is the G8 on Global Health? Trends in Donor Funding for - - PowerPoint PPT Presentation

where is the g8 on global health trends in donor funding
SMART_READER_LITE
LIVE PREVIEW

Where is the G8 on Global Health? Trends in Donor Funding for - - PowerPoint PPT Presentation

Where is the G8 on Global Health? Trends in Donor Funding for Health, 2001-2008 Jen Kates, Kaiser Family Foundation July 7, 2010 Washington DC CSIS/KFF Briefing: The G8 Muskoka and G20 Toronto Summits Health and Development Outcomes Full


slide-1
SLIDE 1

Jen Kates, Kaiser Family Foundation July 7, 2010 Washington DC CSIS/KFF Briefing: “The G8 Muskoka and G20 Toronto Summits Health and Development Outcomes”

Full report: KFF, Donor Funding for Health in Low- and Middle- Income Countries, 2001-2008, Menlo Park: Kaiser Family Foundation (July 7, 2010), available at http://globalhealth.kff.org/ Authors: Jen Kates/Adam Wexler, KFF; Eric Lief/Vidal Seegobin, The Stimson Center

Where is the G8 on Global Health? Trends in Donor Funding for Health, 2001-2008

slide-2
SLIDE 2

Figure 1

Total ODA Commitments for Health and All Other ODA, 2001-2008

$7.6 $7.8 $11.3 $13.9 $17.5 $19.9 $23.4 $26.4 $47.5 $56.9 $78.5 $84.5 $105.1 $102.7 $103.5 $131.7 2001 2002 2003 2004 2005 2006 2007 2008 Other ODA Health ODA

Note: Amounts in gross US$ commitments. Health ODA combines data from four OECD CRS sub-sectors: (1) Health; (2) Population Policies/Programs and Reproductive Health (includes HIV/AIDS & STDs); (3) Water Supply/Sanitation; and (4) Other Social Infrastructure and Services - Social Mitigation of HIV/AIDS Source: Analysis of data obtained via

  • nline query of the OECD Development Assistance Committee (DAC) Database and Creditor Reporting System (CRS), June 22, 2010.

US$ Billions $55.1 $64.7 $98.4 $122.5 $122.7 $126.9 $158.2 $89.7

Global Economic Crisis…

slide-3
SLIDE 3

Figure 2

Share of ODA Commitments by Major Sector, 2001, 2004, 2008

13.8% 14.1% 16.7% 19.9% 18.0% 18.2% 19.7% 17.3% 18.6% 7.8% 4.7% 6.6% 8.7% 13.4% 12.0% 7.4% 9.5% 7.3% 7.6% 8.3% 6.3% 9.7% 7.8% 7.5% 5.6% 6.9% 6.8% 2001 2004 2008

Emergency Assistance Production Debt Relief Education Government/Civil Society Commodity Aid Economic Infrastructure Multisector/Cross Cutting Health

$158.2 $55.1 US$ Billions $98.4

Notes: Amounts in gross US$ commitments. Health ODA combines data from four OECD CRS sub-sectors: (1) Health; (2) Population Policies/Programs and Reproductive Health (includes HIV/AIDS & STDs); (3) Water Supply/Sanitation; and (4) Other Social Infrastructure and Services - Social Mitigation of HIV/AIDS. Multisector/Other ODA combines data from six OECD CRS sectors and sub-sectors: (1) Multisector/Cross-cutting; (2) Administrative Costs of Donors; (3) Support of NGO’s; (4) Refugees in Donor Countries; (5) Unallocated/Unspecified; and (6) Other Social Infrastructure & Services (excluding Social Mitigation of HIV/AIDS). Source: Analysis of data obtained via online query of the OECD Development Assistance Committee (DAC) Database and Creditor Reporting System (CRS), June 22, 2010.

slide-4
SLIDE 4

Figure 3

The 2007-2008 ODA Increase: Drivers of Growth by Sector

31.3% 16.5% 16.0% 9.9% 8.0% 7.9% 6.4% 2.8% 1.4%

Economic Infrastructure Multisector/Other Commodity Aid Health Production Government/Civil Society Emergency Assistance Debt Relief Education

ODA Growth, 2007-2008: $31.3 billion

Notes: Amounts in gross US$ commitments. Health ODA combines data from four OECD CRS sub-sectors: (1) Health; (2) Population Policies/Programs and Reproductive Health (includes HIV/AIDS & STDs); (3) Water Supply/Sanitation; and (4) Other Social Infrastructure and Services - Social Mitigation of HIV/AIDS. Multisector/Other ODA combines data from six OECD CRS sectors and sub-sectors: (1) Multisector/Cross-cutting; (2) Administrative Costs of Donors; (3) Support of NGO’s; (4) Refugees in Donor Countries; (5) Unallocated/Unspecified; and (6) Other Social Infrastructure & Services (excluding Social Mitigation of HIV/AIDS). Source: Analysis of data obtained via online query of the OECD Development Assistance Committee (DAC) Database and Creditor Reporting System (CRS), June 22, 2010.

slide-5
SLIDE 5

Figure 4

United States $8.2 (31.1%) European DAC $7.4 (28.1%) EC $0.8 (3.1%) Multi-lateral $6.4 (24.2%) Other $3.6 (13.5%)

Health ODA Commitments by Donor, 2001 & 2008

United States $1.7 (22.2%) European DAC $2.1 (28.2%) EC $.5 (6.9%) Multilateral $2.3 (31.0%) Other $.9 (11.8%)

Total = $7.6 billion Total = $26.4 billion 2001 2008 US$ Billions

Notes: Amounts in gross US$ commitments. Health ODA combines data from four OECD CRS sub-sectors: (1) Health; (2) Population Policies/Programs and Reproductive Health (includes HIV/AIDS & STDs); (3) Water Supply/Sanitation; and (4) Other Social Infrastructure and Services - Social Mitigation of HIV/AIDS. Source: Analysis of data obtained via

  • nline query of the OECD Development Assistance Committee (DAC) Database and Creditor Reporting System (CRS), June 22, 2010.
slide-6
SLIDE 6

Figure 5

Sub- Saharan Africa 43.5% South/ Central Asia 13.3% Global 17.9% Far East Asia 8.7% North/ Central America 2.7% Middle East 6.1% Noth Africa 2.5% South America 2.2% Europe 2.2% Oceania 0.9%

Health ODA Commitments by Region, 2001 & 2008

Sub- Saharan Africa 37.2% South/ Central Asia 15.8% Global 11.1% Far East Asia 14.1% North/ Central America 3.5% Middle East 6.0% North Africa 5.5% South America 2.9% Europe 2.6% Oceania 1.2%

2001 2008 Total = $7.6 billion Total = $26.4 billion US$ Billions

Notes: Amounts in gross US$ commitments. Health ODA combines data from four OECD CRS sub-sectors: (1) Health; (2) Population Policies/Programs and Reproductive Health (includes HIV/AIDS & STDs); (3) Water Supply/Sanitation; and (4) Other Social Infrastructure and Services - Social Mitigation of HIV/AIDS. Global totals include ODA for unspecified recipients and regional programs. Source: Analysis of data obtained via online query of the OECD Development Assistance Committee (DAC) Database and Creditor Reporting System (CRS), June 22, 2010.

slide-7
SLIDE 7

Figure 6

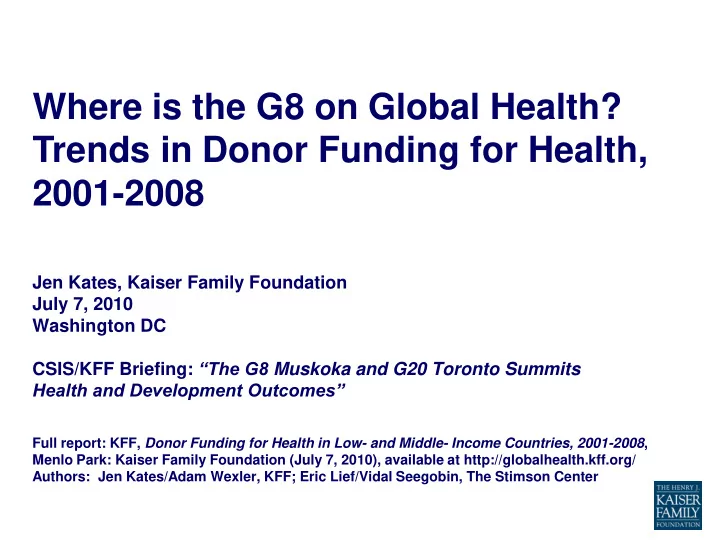
$0.06 $0.18 $0.21 $0.24 $0.95 $1.16 $4.90 $0.06 $0.09 $0.11 $0.17 $0.25 $0.30 $0.38 $0.47 $0.56 $0.59 $1.03 $1.26 $1.47 $1.57 $2.47 $7.94

Water Education and Training Waste Management & Disposal Water Resources Protection River Development Water Resources Policy & Admin. Management Basic Drinking Water Supply & Sanitation Water Supply/Sanitation - Large Systems Health Education Medical Education & Training Health Personnel Development* Medical Research Basic Nutrition Population Policy & Admin. Management Medical Services Tuberculosis Control Basic Health Infrastructure Family Planning Infectious Disease Control Malaria Control Health Policy & Admin. Management Reproductive Health Basic Health Care HIV/AIDS & STDs*

Health ODA Commitments by Major Sub-Sector Activity, 2008

Total Health ODA: $26.4 billion

US$ Billions

Notes: Amounts in gross US$ commitments. “HIV/AIDS & STDs” represents combined data from two OECD CRS purpose codes: (1) STD control including HIV/AIDS; and (2) Social mitigation of HIV/AIDS. “Health Personnel Development” represents combined data from two OECD CRS purpose codes: (1) Health personnel development; and (2) Personnel development: population and reproductive health. Source: Analysis of data obtained via online query of the OECD Development Assistance Committee (DAC) Database and Creditor Reporting System (CRS), June 22, 2010.

slide-8
SLIDE 8

Figure 7

Take Home Messages & Forward Look

  • ODA for health increased over the period analyzed, even after

adjusting for inflation and exchange rate fluctuations

  • However, some important caveats:
  • Analysis based on most “recent” data available on health ODA – significant lag
  • Reflects budgeting decisions made prior to onset of current global economic crisis
  • Already shows slowing growth rate in health ODA
  • What lies ahead? Is caution about future donor assistance for

health warranted?

  • On the one hand, donor attention to global health remains evident in post-

economic crisis era - new initiatives launched, such as U.S. government’s GHI, G8’s Muskoka MNCH initiative, growing attention to MDG Review Summit in September

  • On the other, preliminary estimates from OECD predict limited overall ODA growth

for 2009–2010, with mixed prospects among donors (ODA relatively flat in both nominal and real terms)

  • Important to monitor how health fares within this trend, including

assessing other markers where possible, including

  • G8 fullfillment of commitments
  • ODA trends from larger donors
  • Global Fund replenishment
  • UN MDG Summit