WAVILA WP3 Benchmarking Christian Kraetzer, Jana Dittmann, Andreas - - PowerPoint PPT Presentation

wavila wp3
SMART_READER_LITE
LIVE PREVIEW

WAVILA WP3 Benchmarking Christian Kraetzer, Jana Dittmann, Andreas - - PowerPoint PPT Presentation

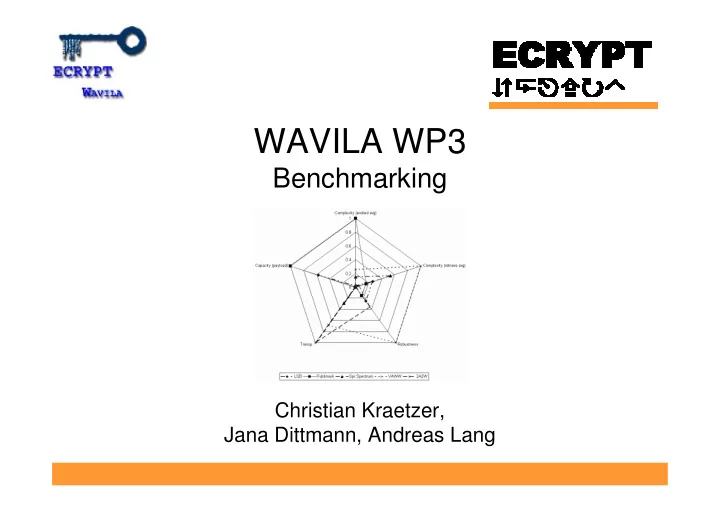
WAVILA WP3 Benchmarking Christian Kraetzer, Jana Dittmann, Andreas Lang Motivation Evaluation is an important research field Promises improvements Identifies application fields Content protection, Authentication,


slide-1
SLIDE 1

WAVILA WP3

Benchmarking

Christian Kraetzer, Jana Dittmann, Andreas Lang

slide-2
SLIDE 2

Motivation

  • Evaluation is an important research field
  • Promises improvements
  • Identifies application fields

– Content protection, – Authentication, – Integrity protection, – DRM, – Annotation, . . .

  • Benchmarking provides recommendations

– Based on the application field watermarking algorithms have to fulfil different parameter settings like: robustness/fragility, transparency, capacity, . . .

slide-3
SLIDE 3

But …

how can benchmarking be done?

  • Generally: Many ways possible to evaluate WM

– subjective tests, single attacks, application scenarios, . . .

  • 1999, Kutter, Petitcolas, for images

– Attacks: JPEG, Geometric Transform, Gamma, Histogramm, Color, Noise, etc.

  • Some early benchmarking tool sets:

– StirMark for Images (www.petitcolas.net/fabien/watermarking/stirmark/) – Optimark (poseidon.csd.auth.gr/optimark/download.htm) – Certimark (www.igd.fhg.de/igd-a8/projects/certimark/) – Checkmark (watermarking.unige.ch/Checkmark/) – Image WET (www.datahiding.org)

  • Some of the questions raised by the state of the art and

answered by WP3:

– How can benchmarking results be made comparable? – How can they be made interpretable for non-experts?

slide-4
SLIDE 4

How can benchmarking results be made comparable? – Some measures applicable

Need for a definition, formalisation and measurement of watermarking properties with the aim of comparability

BER – Bit Error Rate BBER Bit Burst Error Rate BLER – Bit Lost Error Rate HFR/LFR – High-, Low Frequency Ratio MPSNR – Masked Peak Signal to Noise Ratio PSNR – Peak Signal to Noise Ratio RMS – Root Mean Square SNR – Signal to Noise Ratio TPE – Total Perceptual Error WJR – Wrong Judge Rate ZCR – Zero Crossing Rate

slide-5
SLIDE 5
  • 2001, Dittmann, Fates, Fontaine, Petitcolas, Raynal,

Steinebach, Seibel

– 6 own, unspecified audio files

  • 2003, Tachibana

– 3 own, unspecified audio files

  • 2005, Donovan, Hurley, Silvestre

– 1000 own unspecified audio files, CD quality, 30s each

  • 2007, Steinebach

– 1000 own unspecified audio files, CD quality

  • 2007, Wang, Huang, Yat-Sen

– 5 own unspecified audio files, 44.1kHz., 16 bit, mono, 10s each

How can benchmarking results be made comparable? – Some test sets used

Need for the generation and distribution of test sets with the aim of comparability

slide-6
SLIDE 6
  • Evaluation definition,

measurements, strategies, etc are required … … and introduced for the example of audio watermarking!

slide-7
SLIDE 7

Benchmarking framework

  • Theoretical benchmarking framework: definitions and

formalisations

  • Design of application profile depending audio signal

modifications (malicious/non-malicious)

  • Definition and formalisation of benchmarking profiles
  • Evaluation methodology for practical framework
  • Evaluation of:

– Single attacks – Digital audio watermark schemes: basic profiles – Digital audio watermark schemes: application profiles

  • Application of the introduced framework to exemplarily

selected WM schemes

slide-8
SLIDE 8

The results are comparable because …

  • Measured properties comparable

– Standardised definition of measured features – Normalisation of measured values

  • Evaluated watermarking schemes

comparable

– Measure same properties – Measure with same measurement function – Same test set

slide-9
SLIDE 9

How can benchmarking results be made interpretable for non-experts?

  • Recommendation of watermarking schemes

Audio Watermarking Algorithm Test Goal

slide-10
SLIDE 10
  • Application scenario

specific benchmarking

  • Identification (and

description) of relevant characteristics

  • Choice of easily

understandable presentations/visualisations

How can benchmarking results be made interpretable for non-experts?

slide-11
SLIDE 11

How can benchmarking results be made interpretable for non-experts?

slide-12
SLIDE 12

Practical Evaluation Results

Basic Profile: Transparency and Robustness for different kinds of audio material and 6 exemplarily chosen watermarking algorithms

Inter Algorithm Evaluation and Analysis

Light gray: Transparency Dark gray: Robustness

slide-13
SLIDE 13

Further scopes of WP3

  • example: PHDG
slide-14
SLIDE 14

Future Directions

  • Generalisation of the introduced approach for audio

watermarking benchmarking to other types of media

  • How can benchmarking results be made

interpretable for non-experts?

  • “Is benchmarking an academic chimera?” –

scientists tend to test based on very specific theoretical assumptions

slide-15
SLIDE 15

Thank you very much for your attention!