
SLIDE 1
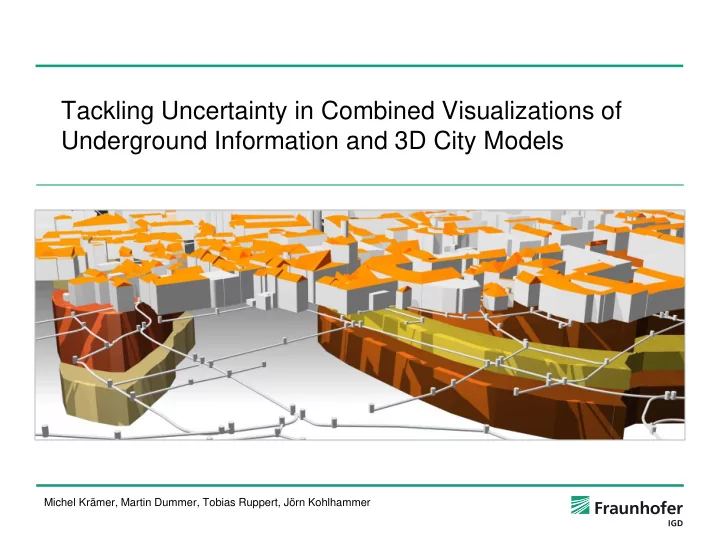
Tackling Uncertainty in Combined Visualizations of Underground Information and 3D City Models
Michel Krämer, Martin Dummer, Tobias Ruppert, Jörn Kohlhammer
Tackling Uncertainty in Combined Visualizations of Underground - - PowerPoint PPT Presentation
Tackling Uncertainty in Combined Visualizations of Underground Information and 3D City Models Michel Krmer, Martin Dummer, Tobias Ruppert, Jrn Kohlhammer Motivation The data structures of city models is very different from those of
Michel Krämer, Martin Dummer, Tobias Ruppert, Jörn Kohlhammer
Michel Krämer, Martin Dummer, Tobias Ruppert, Jörn Kohlhammer
Michel Krämer, Martin Dummer, Tobias Ruppert, Jörn Kohlhammer
Michel Krämer, Martin Dummer, Tobias Ruppert, Jörn Kohlhammer
Sources of uncertainty (MacEachren et al. 2005) Michel Krämer, Martin Dummer, Tobias Ruppert, Jörn Kohlhammer
Pang et al. 1996 Michel Krämer, Martin Dummer, Tobias Ruppert, Jörn Kohlhammer
Pang et al. 1996 Michel Krämer, Martin Dummer, Tobias Ruppert, Jörn Kohlhammer
Pang et al. 1996 Michel Krämer, Martin Dummer, Tobias Ruppert, Jörn Kohlhammer
Pang et al. 1996 Michel Krämer, Martin Dummer, Tobias Ruppert, Jörn Kohlhammer
Michel Krämer, Martin Dummer, Tobias Ruppert, Jörn Kohlhammer
Michel Krämer, Martin Dummer, Tobias Ruppert, Jörn Kohlhammer
Michel Krämer, Martin Dummer, Tobias Ruppert, Jörn Kohlhammer
Michel Krämer, Martin Dummer, Tobias Ruppert, Jörn Kohlhammer