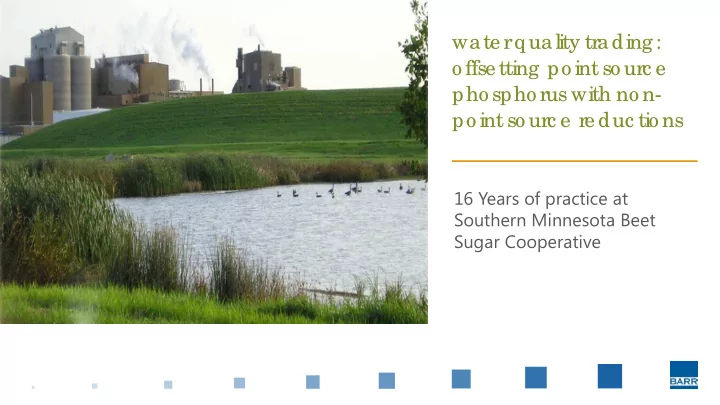
SLIDE 1 water quality tr ading:
c e pho spho r us with no n- po int so ur c e r educ tio ns
16 Years of practice at Southern Minnesota Beet Sugar Cooperative
SLIDE 2
factory is located on 2.5 sections in southern Minnesota processes 3,000,000+ tons of sugarbeets annually 500 grower owners on 120,000 acres land annually 400 full time and seasonal workers $920 million impact on area economy
So uthe rn Minne so ta Be e t Sug a r Co o pe ra tive
SLIDE 3
- 1970s, 1980s, 1990s: the facility used spray
irrigation to dispose of treated water
- with wastewater generation in fall, winter,
spring, with pond storage until irrigation, the old system generated odors and hydrogen sulfide
- wastewater treatment plant with a new
discharge was proposed in 1999 in-part to address odor issues
- the new system requires less storage of
untreated wastewater
SMBSC’s wastewater treatment system was converted in 1999 from a spray irrigation facility to a wastewater treatment plant with stream discharge
NPDE S/ SDS pe rmitting histo ry
SLIDE 4
120 (or so) acres of pond surface wastewater originates from the beets that are 70% water wastewater can be very strong—up to 30,000 mg/L COD wastewater must be stored before irrigation—that storage can be a significant source of odor and hydrogen sulfide
pre -1999 wa ste wa te r tre a tme nt syste m—spra y irrig a tio n
SLIDE 5
- low flow sampling efforts in the early 1980s
informed modeling and waste load allocation studies
- 1988 historic low flow conditions and CBOD5 WLA
established
- 1992 river listed impaired for dissolved oxygen
during low flow
- 1999 SMBSC discharge permit with phosphorous
non-point source trading
- 2004 – EPA approves MN River low DO TMDL
- Point-point source phosphorous trading permit
established
- 2012 – low flow sampling meets TMDL goals
the state’s understanding
- f the impaired waters and
the impacts of point sources and nonpoint sources on the impairment have evolved over time
impa ire d wa te rs do wnstre a m—lo we r MN Rive r, summe r lo w flo w, lo w disso lve d o xyg e n impa irme nt
SLIDE 6
- annual mass cap for phosphorus discharged
was 5,000 lbs P per year
- nonpoint BMPs were the source of trades
- the permit specifies the eligible BMPs and the
method for computing trade value
- eligible trades: soil erosion BMPs (cover
cropping), cattle exclusion, rotational grazing, critical area set aside, constructed wetland treatment systems, alternative surface tile inlets
- one credit equals one pound of NPS
reduction
- the permit requires a 2.6:1 trade ratio
the 1999 goal for the lower MN River was 40% reduction of sediment and phosphorus loading. SMBSC had to offset its full permitted phosphorus loading via water quality trading.
wa te r q ua lity tra ding wa s use d to o ve rc o me a pro hib itio n
- n ne w a nd e xpa nde d disc ha rg e rs to impa ire d wa te rs
SLIDE 7
- “The conversion from spray irrigation of wastewater to a surface
water discharge and subsequent changes to the wastewater treatment facility are intended to result in substantial reductions in
- dor and hydrogen sulfide emissions.”
- “The proposed wastewater treatment facility addresses air quality
issues and produces an effluent meeting water quality standards with minimal impacts to the receiving water.”
1999 MPCA a ntide g ra da tio n e va lua tio n
SLIDE 8
the permit allowed time for SMBSC to develop, plan, and build NPS BMPs
1999 SMBSC NPDE S pe rmit c o nside ra tio ns
SLIDE 9
- “hot spots” in local waters were prevented by limiting discharge to summer
periods when stream flow residence time was less than 3.0 days (i.e., algae growth, doubling time)
- all trades had to be within MN River basin, downstream of an “impoundment”
- $300,000 “trust fund” for trades
- credit approval/issuance process
– 45% at contract signing – 45% after construction – 10% for vegetation establishment
- where state and federal funds were used, credit was allowed only for the portion
funding by SMBSC
- credit stacking was not allowed—wetland credits could not also be generated
- annual reports and MPCA conducted audits
1999 SMBSC NPDE S pe rmit c o nside ra tio ns—o the r c o nside ra tio ns
SLIDE 10
SMBSC was able to meet its permit requirements for water quality trading
1999 SMBSC NPDE S pe rmit re sults
SLIDE 11
c a ttle site – e xc lusio n a nd stre a mb a nk sta b iliza tio n
1,475 c re dits
SLIDE 12
c o ve r c ro p o n sug a r b e e ts—a b o ut 0.2 c re dits pe r a c re
sma ll g ra in c o ve r c ro p, pla nte d with sug a r b e e ts, kille d o r re mo ve d whe n sug a r b e e ts ne a r full c a no py
SLIDE 13 the 2004 TMDL and WLA focused
not nonpoint sources
b y 2004, po int so urc e s we re unde rsto o d to b e the sig nific a nt c o ntrib uto r to the MN Rive r impa irme nt
SLIDE 14
2004 pe rmit c o nditio ns
1. local surface water impacts 2. summer impacts on MN River 3. SMBSC, with seasonal discharge, does not cause or contribute to MN River impairment 4. water quality concerns for Lake Pepin, impairment know and TMDL was underway 5. MPCA was spending too much time on the permit 6. SMBSC did not need its full mass cap
1. discharge moved to limited resource value water 2. seasonal discharge—September through March 3. SMBSC and MPCA considered terminating trading program 4. continued the trading program, but allowed up to 20% out of MN River basin (upstream of Lake Pepin) 5. created an auditing function/requirement in the permit 6. SMBSC took a lower permit limit, 2,500 lbs P per year mass limit
issue s re so lutio n
SLIDE 15
SMBSC has been able to meet its permit requirements for water quality trading, largely due the success of the sugar beet cover crop BMP
2004 SMBSC NPDE S pe rmit re sults
SLIDE 16 c o ve r c ro p BMP a do ptio n to o k o ff a fte r 2004
sugar production with BMP than without BMP
- mainly due to less spring
replant
when early stage sugar beets are damaged by the wind
damage and thus reduced the need for replant
why?
SLIDE 17
- credits approved, 140,000 (one credit equals one pound P)
- credits required, 65,000
- discharged P
, 10,200 lbs P (discharge allowed, 25,000)
- actual trade ratio is 13.7:1
tra ding a nd disc ha rg e sinc e 2005—c umula tive 2005- 2014
SLIDE 18
- water quality trading (and it’s complete offset of P) helped SMBSC
- btain a permit to discharge treated effluent
- a permit to discharge helped SMBSC eliminate reliance on pond
storage and irrigation
- eliminating its reliance on pond storage and irrigation helps SMBSC
reduce hydrogen sulfide emissions and odor
- water quality trading is a huge administrative burden to implement
and document—each BMP must be documented annually: one major cattle exclusion BMP site and just shy of 1,000 cover crop fields each year
SMBSC’ s o ve ra ll e xpe rie nc e with tra ding —a summa ry
SLIDE 19 1. accomplishes regulatory and environmental goals 2. is based on sound science 3. provides accountability, transparency, accessibility, and public participation to ensure that promised water quality improvements are delivered 4. does not produce localized water quality impacts 5. is consistent with the CWA regulatory framework 6. includes appropriate compliance and enforcement provisions to ensure long- term success
- …and provides efficient and effective ways for point sources to meet their CWA
goals and provides the right conditions for landowners to participate
- source: “building a water quality trading program: options and considerations”,
June 2015, National Network on Water Quality Trading
visio n a nd g uiding princ iple s fo r wa te r q ua lity tra ding pro g ra ms
SLIDE 20
q ue stio ns