
SLIDE 1
Understanding the University Budget 1 WA S H I N G T O N S T AT E U N I V E R S I T Y
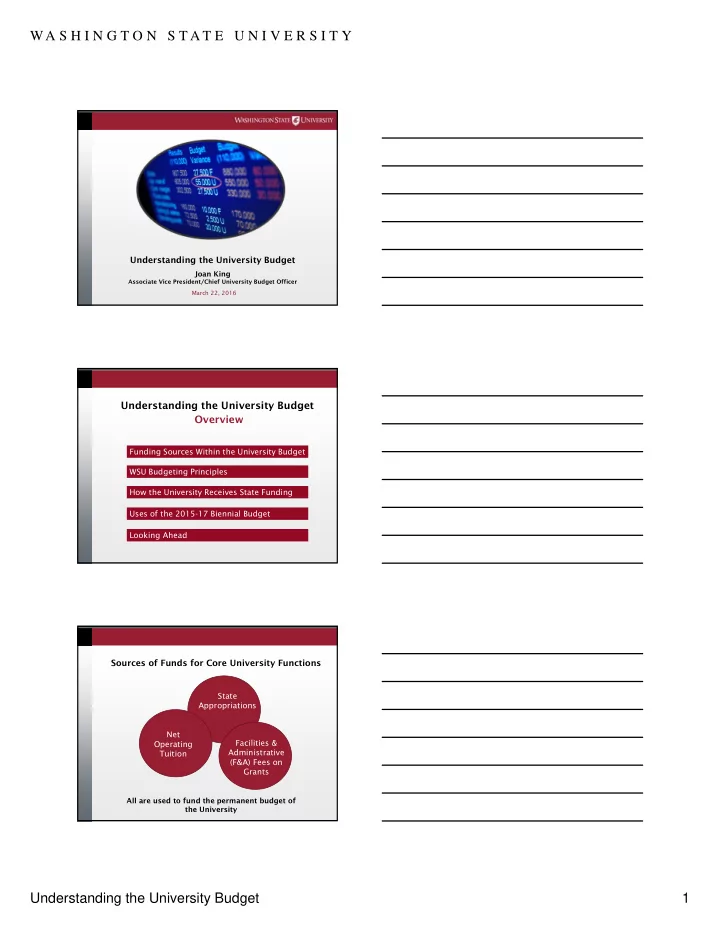
Understanding the University Budget
Joan King
Associate Vice President/Chief University Budget Officer March 22, 2016
WA S H I N G T O N S T AT E U N I V E R S I T Y Understanding the - - PDF document
WA S H I N G T O N S T AT E U N I V E R S I T Y Understanding the University Budget Joan King Associate Vice President/Chief University Budget Officer March 22, 2016 Understanding the University Budget Overview Funding Sources Within the
Associate Vice President/Chief University Budget Officer March 22, 2016
Operating 87% Capital 13%
$296.7M $2.0B
Total Authority: $311.7 M Projected Expenditures: $296.7 M
(includes Reappropriation Balances)
S&A Fees & Athletics less than1% each WSU Building/Land Grant Endowment 16% Housing & Dining 4% Local/Private 53% State General Obligation Bonds 26% Parking 1%
* Available for allocation
*Net Operating Tuition & Fees 24% Net Restricted Student Fees 4% Federal Grants & Contracts 16% State Grants & Contracts 9% Local Grants & Contracts 3% Ed Dept Sales & Services 2% Auxiliary Enterprises 14% *State Appropriations 16% Other 1% Net Investment Income - 6% Federal Appropriations 1% Gifts/Endowment – 4%
WSU is one of only a few institutions that do not “tax” donated funds
* 3% fee on bequests and liquidations of trusts
23% to F&A Revenue Generating Units 7% Libraries 38% Campus Support 28% University Support 4% Office of Research
For more information: BPPM 40.25
PULLMAN CONTRACTS URBAN CAMPUS CONTRACTS
WITH Academic Unit Affiliation
URBAN CAMPUS CONTRACTS
WITHOUT Academic Unit Affiliation
Department: 15% Dean: 8% Academic Dean: 11.5% Chancellor: 11.5% Chancellor: 23%
OK with Dean’s approval unless restrictions/provisos
OK with Dean’s approval unless restrictions/provisos
Not allowed
Reviewed on case-by-case basis
* WSU Vancouver, WSU Tri-Cities, Extension, and Ag Research manage their own accruals.
payouts), and PIDs
positions on WSU program 05 (libraries) and 06 (instruction)
(programs 11A-14Y) regardless of employee type
professional, and non-instructional faculty positions for the first four months. Subsequent accruals are returned to areas upon request
Governor’s Budget Recommendation
(December, Even Years)
House Budget
(Spring, Odd Years)
Senate Budget
(Spring, Odd Years)
Institutional Budget Requests
(Summer, Even Years) Conference Committee Budget Passage by House Signed by Governor Allotments to Agencies Passage by Senate
OFM Scoring Process
Mix of Funding between State Funds and WSU Local Funds Including New WSU Debt Authorization
Calculation of Agency Budgets
at Carryforward Levels (Summer, Even Years)
Revenue Estimates
(Summer, Even Years, then updated throughout the process)
Calculation of 601 Expenditure Limits
(Summer, Even Years)
Governor’s Budget Recommendation (December, Even Years) House Budget
(Spring, Odd Years)
Senate Budget
(Spring, Odd Years)
Conference Committee Budget Passage by Senate Signed by Governor Allotments to Agencies Passage by House Agency Budget Request
(Summer, Even Years)
(in 2013 Dollars)
$0 $2,000 $4,000 $6,000 $8,000 $10,000 $12,000 $14,000 $16,000 $18,000 $20,000 FY 1990 FY 1991 FY 1992 FY 1993 FY 1994 FY 1995 FY 1996 FY 1997 FY 1998 FY 1999 FY 2000 FY 2001 FY 2002 FY 2003 FY 2004 FY 2005 FY 2006 FY 2007 FY 2008 FY 2009 FY 2010 FY 2011 FY 2012 FY2013 FY2014 FY2015 Total Funding Per Student State Support Per Student Tuition Revenue per Student 84% 16% 59% 41%
2015-17 Biennium
academic year 2015-16 and will be reduced by an additional 10% in academic year 2016-17, per legislative mandate and funding.
categories, WSU opted for no tuition increase in academic year 2015-16, per President Floyd. 2013-15 Biennium
2011-13 Biennium Governing boards were authorized to increase tuition (including operating and building fees)
(authority established by Legislature in appropriations act each biennium)
(authority in RCW) *Institutions had authority for higher increases but would trigger financial aid mitigation requirements.
Research 9% Plant Operations & Maintenance 9% Student Services 5% Library 2% Primary Support 9% Public Service 6% Institutional Support 10% Instruction 50%
Minor Capital Projects – 20% Preventative Maintenance (Operating) – 7% Major Capital Projects – 73%
Salaries and Wages 67% Benefits 18% Operations 15%
Policy Level
$0.832M
($0.773M requested in state funds, remainder covered by WSU
$1M Maintenance Level
$0.114M
(State Funds, $ thousands) WSU Request Governor’s Budget House Budget Senate Budget Current Biennium $419,891 $419,891 $419,891 $419,891 Maintenance Level Adjustments1 $ 114 $ 193 $ 272 $ 272 Policy Level Adjustments2 Expansion in Everett $ 773
$ 1,000
Administrative Efficiencies
Marijuana Breathalyzer
Honey Bee Biology Researcher
Proposed Supplemental $421,778 $420,084 $421,586 $422,600 % Change from current biennium 0.45% 0.05% 0.40% 0.65%
1 The maintenance level budget represents the cost of providing currently authorized services in the new budget period. 2 Policy level adjustments allow for new or expanded services in the ensuing budget period.