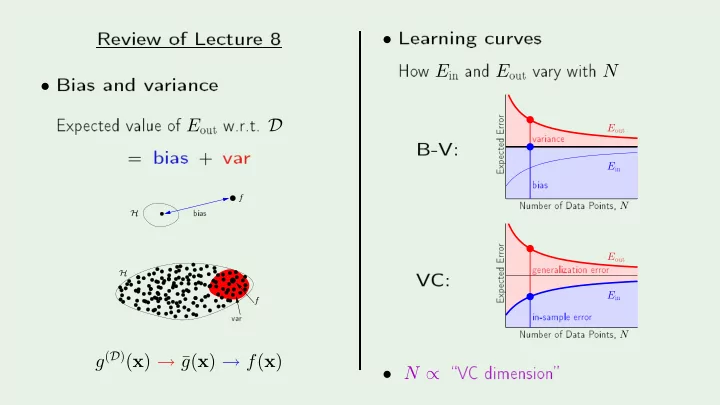
w E and E va ry with N in out 20 Bias and va riane 40 60 - - PowerPoint PPT Presentation

w e and e
SMART_READER_LITE
LIVE PREVIEW

w E and E va ry with N in out 20 Bias and va riane 40 60 - - PowerPoint PPT Presentation

PSfrag replaements Lea rning urves Review of Leture 8 PSfrag replaements Ho w E and E va ry with N in out 20 Bias and va riane 40 60 Exp eted value of E w.r.t. D 80 out 0.16 B-V: 0.17 bias + va r out


slide-1
SLIDE 1 Review
  • f
Le ture 8
  • Bias
and va rian e Exp e ted value
  • f E
  • ut
w.r.t. D

=

bias + va r

f H

bias va r

f H

g(D)(x) → ¯ g(x) → f(x)

  • Lea
rning urves Ho w E in and E
  • ut
va ry with N PSfrag repla ements Numb er
  • f
Data P
  • ints, N
Exp e ted Erro r bias va rian e

E

  • ut

E

in 20 40 60 80 0.16 0.17 0.18 0.19 0.2 0.21 0.22 PSfrag repla ements Numb er
  • f
Data P
  • ints, N
Exp e ted Erro r in-sample erro r generalization erro r

E

  • ut

E

in 20 40 60 80 0.16 0.17 0.18 0.19 0.2 0.21 0.22
  • N ∝
V C dimension B-V: V C:
slide-2
SLIDE 2 Lea rning F rom Data Y aser S. Abu-Mostafa Califo rnia Institute
  • f
T e hnology Le ture 9: The Linea r Mo del I I Sp
  • nso
red b y Calte h's Provost O e, E&AS Division, and IST
  • T
uesda y , Ma y 1, 2012
slide-3
SLIDE 3 Where w e a re
  • Linea
r lassi ation
  • Linea
r regression
  • Logisti
regression ?
  • Nonlinea
r transfo rms

  • A

M L

Creato r: Y aser Abu-Mostafa
  • LFD
Le ture 9 2/24
slide-4
SLIDE 4 Nonlinea r transfo rms

x = (x0, x1, · · · , xd)

Φ

− →

z = (z0, z1, · · · · · · · · · · · · , z ˜

d)

Ea h zi = φi(x)

z = Φ(x)

Example:

z = (1, x1, x2, x1x2, x2

1, x2 2)

Final hyp
  • thesis g(x)
in X spa e: sign

˜ w

TΦ(x)
  • r

˜ w

TΦ(x)

A

M L

Creato r: Y aser Abu-Mostafa
  • LFD
Le ture 9 3/24
slide-5
SLIDE 5 The p ri e w e pa y

x = (x0, x1, · · · , xd)

Φ

− →

z = (z0, z1, · · · · · · · · · · · · , z ˜

d)

↓ ↓ w ˜ w d

v = d + 1

d

v ≤ ˜

d + 1

A

M L

Creato r: Y aser Abu-Mostafa
  • LFD
Le ture 9 4/24
slide-6
SLIDE 6 T w
  • non-sepa
rable ases PSfrag repla ements
  • 1
  • 0.5
0.5 1
  • 1.5
  • 1
  • 0.5
0.5 1 1.5

A

M L

Creato r: Y aser Abu-Mostafa
  • LFD
Le ture 9 5/24
slide-7
SLIDE 7 First ase PSfrag repla ements
  • 1
  • 0.5
0.5 1
  • 1.5
  • 1
  • 0.5
0.5 1 1.5 Use a linea r mo del in X ; a ept E in > 0
  • r
Insist
  • n E
in = 0; go to high-dimensional Z

A

M L

Creato r: Y aser Abu-Mostafa
  • LFD
Le ture 9 6/24
slide-8
SLIDE 8 Se ond ase PSfrag repla ements
  • 1
  • 0.5
0.5 1
  • 1.5
  • 1
  • 0.5
0.5 1 1.5

z = (1, x1, x2, x1x2, x2

1, x2 2)

Why not:

z = (1, x2

1, x2 2)

  • r
b etter y et:

z = (1, x2

1 + x2 2)

  • r
even:

z = (x2

1 + x2 2 − 0.6)

A

M L

Creato r: Y aser Abu-Mostafa
  • LFD
Le ture 9 7/24
slide-9
SLIDE 9 Lesson lea rned Lo
  • king
at the data b efo re ho
  • sing
the mo del an b e haza rdous to y
  • ur E
  • ut
Data sno
  • ping
Lea rning F rom Data
  • Le ture
9 8/24
slide-10
SLIDE 10 Logisti regression
  • Outline
  • The
mo del
  • Erro
r measure
  • Lea
rning algo rithm

A

M L

Creato r: Y aser Abu-Mostafa
  • LFD
Le ture 9 9/24
slide-11
SLIDE 11 A third linea r mo del

s =

d

  • i=0

wixi

linea r lassi ation linea r regression logisti regression

h(x) =

sign(s)

h(x) = s h(x) = θ(s)

s x x x x0

1 2 d

h x

( )

s x x x x0

1 2 d

h x

( )

s x x x x0

1 2 d

h x

( )

A

M L

Creato r: Y aser Abu-Mostafa
  • LFD
Le ture 9 10/24
slide-12
SLIDE 12 The logisti fun tion θ The fo rmula:

θ(s) = es 1 + es

PSfrag repla ements

θ(s) 1 s

  • 4
  • 2
2 4 0.5 1 soft threshold: un ertaint y sigmoid: attened
  • ut
`s'

A

M L

Creato r: Y aser Abu-Mostafa
  • LFD
Le ture 9 11/24
slide-13
SLIDE 13 Probabilit y interp retation

h(x) = θ(s)

is interp reted as a p robabilit y Example. Predi tion
  • f
hea rt atta ks Input x : holesterol level, age, w eight, et .

θ(s)

: p robabilit y
  • f
a hea rt atta k The signal s = w Tx risk s o re

h(x) = θ(s)

A

M L

Creato r: Y aser Abu-Mostafa
  • LFD
Le ture 9 12/24
slide-14
SLIDE 14 Genuine p robabilit y Data (x, y) with bina ry y , generated b y a noisy ta rget:

P(y | x) =

  • f(x)
fo r y = +1;

1 −f(x)

fo r y = −1. The ta rget f : Rd → [0, 1] is the p robabilit y Lea rn g(x) = θ(w T x) ≈ f(x)

A

M L

Creato r: Y aser Abu-Mostafa
  • LFD
Le ture 9 13/24
slide-15
SLIDE 15 Erro r measure F
  • r
ea h (x, y) , y is generated b y p robabilit y f(x) Plausible erro r measure based
  • n
lik eliho
  • d:
If h = f , ho w lik ely to get y from x ?

P(y | x) =

  • h(x)
fo r y = +1;

1 − h(x)

fo r y = −1.

A

M L

Creato r: Y aser Abu-Mostafa
  • LFD
Le ture 9 14/24
slide-16
SLIDE 16 F
  • rmula
fo r lik eliho
  • d

P(y | x) =

  • h(x)
fo r y = +1;

1 − h(x)

fo r y = −1. Substitute h(x) = θ(w Tx) , noting θ(−s) = 1 − θ(s) PSfrag repla ements

θ(s) 1 s

  • 4
  • 2
2 4 0.5 1

P(y | x) = θ(y w

Tx) Lik eliho
  • d
  • f D = (x1, y1), . . . , (xN, yN)
is

N

  • n=1

P(yn | xn) =

N

  • n=1

θ(ynw

Txn)

A

M L

Creato r: Y aser Abu-Mostafa
  • LFD
Le ture 9 15/24
slide-17
SLIDE 17 Maximizing the lik eliho
  • d
Minimize

− 1 N ln

  • N
  • n=1

θ(yn w

T xn)
  • =

1 N

N

  • n=1

ln

  • 1

θ(yn w

T xn)
  • θ(s) =

1 1 + e−s

  • E
in(w) = 1

N

N

  • n=1

ln

  • 1 + e−ynw
Txn
  • e(h(xn),yn)
ross-entrop y erro r

A

M L

Creato r: Y aser Abu-Mostafa
  • LFD
Le ture 9 16/24
slide-18
SLIDE 18 Logisti regression
  • Outline
  • The
mo del
  • Erro
r measure
  • Lea
rning algo rithm

A

M L

Creato r: Y aser Abu-Mostafa
  • LFD
Le ture 9 17/24
slide-19
SLIDE 19 Ho w to minimize E in F
  • r
logisti regression,

E

in(w) =

1 N

N

  • n=1

ln

  • 1 + e−ynw
Txn Compa re to linea r regression:

E

in(w) =

1 N

N

  • n=1

(w

Txn − yn)2

← −

losed-fo rm solution

← −

iterative solution

A

M L

Creato r: Y aser Abu-Mostafa
  • LFD
Le ture 9 18/24
slide-20
SLIDE 20 Iterative metho d: gradient des ent PSfrag repla ements W eights, w In-sample Erro r, E in
  • 10
  • 8
  • 6
  • 4
  • 2
2 10 15 20 25 General metho d fo r nonlinea r
  • ptimization
Sta rt at w(0) ; tak e a step along steep est slop e Fixed step size:

w(1) = w(0) + η ˆ v

What is the dire tion ˆ

v

?

E

in(w)

A

M L

Creato r: Y aser Abu-Mostafa
  • LFD
Le ture 9 19/24
slide-21
SLIDE 21 F
  • rmula
fo r the dire tion ˆ

v

∆E

in = E in( w(0) + ηˆ

v ) − E

in(w(0))

= η∇E

in(w(0)) tˆ

v + O(η2) ≥ −η∇E

in(w(0)) Sin e ˆ

v

is a unit ve to r,

ˆ v = − ∇E

in(w(0))

∇E

in(w(0))

A

M L

Creato r: Y aser Abu-Mostafa
  • LFD
Le ture 9 20/24
slide-22
SLIDE 22 Fixed-size step? Ho w η ae ts the algo rithm: PSfrag repla ements W eights, w In-sample Erro r, E in
  • 1
  • 0.8
  • 0.6
  • 0.4
  • 0.2
0.2 0.4 0.6 0.8 1 0.2 0.4 0.6 0.8 1 PSfrag repla ements W eights, w In-sample Erro r, E in
  • 1
  • 0.8
  • 0.6
  • 0.4
  • 0.2
0.2 0.4 0.6 0.8 1 0.05 0.1 0.15 0.2 0.25 PSfrag repla ements W eights, w In-sample Erro r, E in la rge η small η
  • 1
  • 0.8
  • 0.6
  • 0.4
  • 0.2
0.2 0.4 0.6 0.8 1 0.2 0.4 0.6 0.8 1

η

to
  • small

η

to
  • la
rge va riable η
  • just
right

η

should in rease with the slop e

A

M L

Creato r: Y aser Abu-Mostafa
  • LFD
Le ture 9 21/24
slide-23
SLIDE 23 Easy implementation Instead
  • f

∆w = η ˆ v = − η ∇E

in(w(0))

∇E

in(w(0)) Have

∆w = − η ∇E

in(w(0)) Fixed lea rning rate η

A

M L

Creato r: Y aser Abu-Mostafa
  • LFD
Le ture 9 22/24
slide-24
SLIDE 24 Logisti regression algo rithm 1: Initialize the w eights at t = 0 to w(0) 2: fo r t = 0, 1, 2, . . . do 3: Compute the gradient

∇E

in = − 1

N

N

  • n=1

ynxn 1 + e ynw

T(t)xn 4: Up date the w eights: w(t + 1) = w(t) − η∇E in 5: Iterate to the next step until it is time to stop 6: Return the nal w eights w

A

M L

Creato r: Y aser Abu-Mostafa
  • LFD
Le ture 9 23/24
slide-25
SLIDE 25 Summa ry
  • f
Linea r Mo dels Credit Analysis Amoun t
  • f
Credit Appro v e
  • r
Den y Probabilit y
  • f
Default P er eptron Logisti Regression Linea r Regression Classi ation Error PLA, P
  • k
et,. . . Cross-en trop y Error Gradien t des en t Squared Error Pseudo-in v erse

A

M L

Creato r: Y aser Abu-Mostafa
  • LFD
Le ture 9 24/24