Verification of New Mesh-based Rigorous 2 Step Computational Approach - - PDF document

verification of new mesh based rigorous 2 step
SMART_READER_LITE
LIVE PREVIEW

Verification of New Mesh-based Rigorous 2 Step Computational Approach - - PDF document

Transactions of the Korean Nuclear Society Virtual Spring Meeting July 9-10, 2020 Verification of New Mesh-based Rigorous 2 Step Computational Approach for the Shutdown Dose Rate Distributions in the Fusion Facilities Jae Hyun KIM, Myeong Hyeon


slide-1
SLIDE 1

Verification of New Mesh-based Rigorous 2 Step Computational Approach for the Shutdown Dose Rate Distributions in the Fusion Facilities

Jae Hyun KIM, Myeong Hyeon WOO, Chang Ho SHIN, Ser Gi HONG Department of Nuclear Engineering, Hanyang University, 222 Wangsimni-ro, Seongdong, Seoul 133-791, Korea

*Corresponding author: hongsergi@hanyang.ac.kr

  • 1. Introduction

In the nuclear fusion facility, structures and devices in the reactor are activated due to neutron irradiation by high-intensity plasma for a long time. These induce much residual radiation, which leads to various problems. Therefore, it is important to consider the radiation hazards in the design step of the fusion facilities by systematically evaluating and analyzing the residual dose

  • distributions. Generally, to calculate the residual dose,

the rigorous-2-step (R2S) method [1] is conducted using the following procedures: firstly, the neutron particle transport calculation is performed to get total flux (i.e. multi-energy groups integrated flux) and neutron spectra

  • n multi-energy groups of the region of interest;

secondly, activation calculation is performed using total flux and spectra calculated in the first step and irradiation and decay history to obtain nuclide inventories and gamma emission distribution information; finally, if needed, a further calculation is performed by gamma transport calculation to obtain gamma residual dose. In the view of shielding analysis, the existing R2S method has popularly been known and a useful method. However, it has some critical problems. Among them, the spatial resolution problem is the most critical. This is because the existing R2S method conducts on the cell-wise calculation by coupling the particle transport and activation code like the above procedures. Generally, neutron flux and spectra are obtained by the average value over the cell, which means that the cell size should be small enough to represent a flat flux. In order to solve this problem, it is necessary to divide the cells as finely as possible, but, the use of many fine cells increases the statistical error or increases computing time in order to

  • btain reliable results. As a result, the efficiency of the

calculation decreases. In this study, a new computational analysis scheme was developed to overcome spatial resolution issues and to improve calculation efficiency. In our proposed method, total flux and neutron spectra were obtained by MCNP [2] mesh-tally calculation unlike previous cell-wised R2S method and volume fractions of each material occupied in a voxel were calculated through particle tracking. In this work, the developed method was verified by residual radiation calculation on the ITER benchmark problem through comparison with the existing cell-wised R2S method in the same conditions.

  • 2. Methods and Results

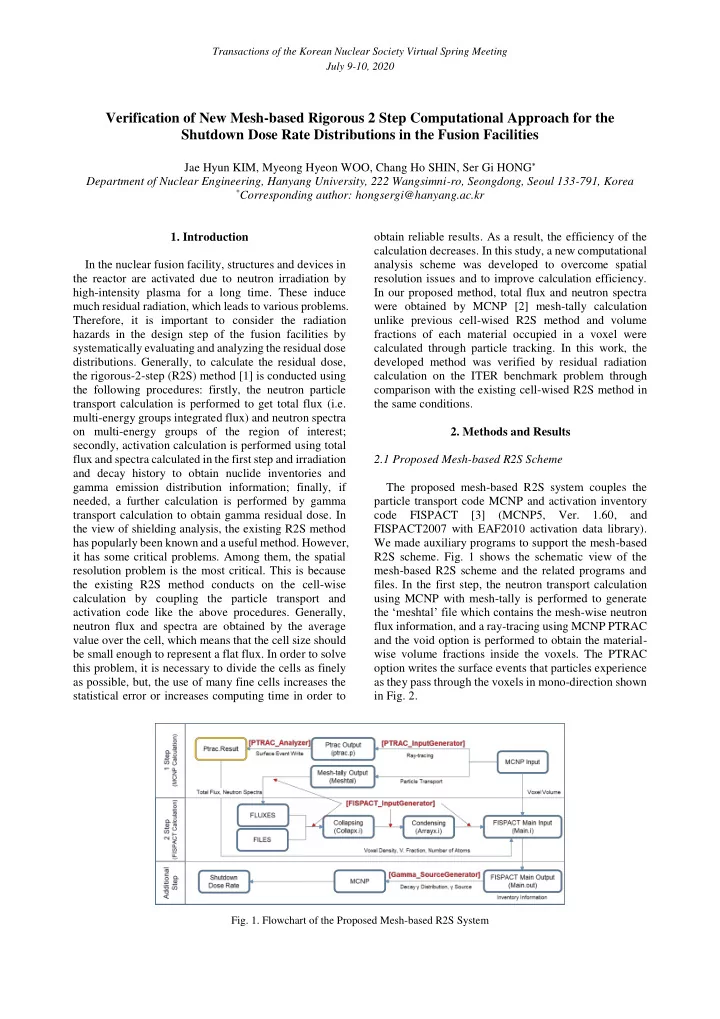
2.1 Proposed Mesh-based R2S Scheme The proposed mesh-based R2S system couples the particle transport code MCNP and activation inventory code FISPACT [3] (MCNP5, Ver. 1.60, and FISPACT2007 with EAF2010 activation data library). We made auxiliary programs to support the mesh-based R2S scheme. Fig. 1 shows the schematic view of the mesh-based R2S scheme and the related programs and

  • files. In the first step, the neutron transport calculation

using MCNP with mesh-tally is performed to generate the ‘meshtal’ file which contains the mesh-wise neutron flux information, and a ray-tracing using MCNP PTRAC and the void option is performed to obtain the material- wise volume fractions inside the voxels. The PTRAC

  • ption writes the surface events that particles experience

as they pass through the voxels in mono-direction shown in Fig. 2.

  • Fig. 1. Flowchart of the Proposed Mesh-based R2S System

Transactions of the Korean Nuclear Society Virtual Spring Meeting July 9-10, 2020

slide-2
SLIDE 2

Volume fraction ( 𝑊

𝑁𝑘 ) from the PTRAC output

(ptrac.result) are calculated by the following equations: 𝑊

𝑁𝑘 = 𝑊

𝑀 × ∑ 𝑚𝑁𝑘

𝑗 𝑜 𝑗=1

(1) where 𝑁

𝑘 represents a material for 𝑘, 𝑚𝑁𝑘 𝑗 is an 𝑗𝑢ℎ track-

length in the voxel passing through the material 𝑘, 𝑀 is the total track-length which is accumulated in the voxel, and 𝑊 is the volume of the voxel. The statistical accuracy

  • f the volume fraction occupied by cells inside each

voxel depends on the number of PTRAC events. The MCNP input file for ray-tracing is automatically generated using the ‘PTRAC InputGenerator’ program.

  • Fig. 2. Ray-tracing in a Voxel

In the second step, the activation analysis is performed using FISPACT, where the ‘Collapx’ program generates the one-group cross-sections and then the ‘Arrayx’ one merges the decay data with the one-group cross-section. The ‘FISPACT InputGenerator’ automatically generates the input files for the ‘Collapx’ and ‘Arrayx’ programs and a script file for the automatic run of FISPACT. The run of the ‘Main’ program of FISPACT generates its

  • utput ‘main.out’ which includes various data such as the

nuclide inventories. The last step is to calculate the shutdown dose rates using gamma transport calculations with MCNP. The gamma sources for this step are automatically prepared with the ‘Gamma_SourceGenerator’ using the results

  • f
  • FISPACT. The shutdown gamma sources are calculated

by FISPACT for each voxel except for the void region. The gamma source intensity is properly weighted by materials densities occupied by cells inside each voxel. To utilize gamma distribution calculated by activation calculation in each voxel as a gamma source, the gamma_source module makes the MCNP SDEF source definition card. 2.2 Verification on ITER Residual Gamma Benchmark A dedicated verification assessment of the proposed mesh-based R2S system has been conducted on the modified ITER benchmark problem [4]. In this work, the sufficiently segmented cell-based R2S calculations were used to generate a reference result. The geometry of the problem (see Fig. 3) consists of a 550 cm long cylindrical shell (200 cm diameter) of steel encompassing a steel (70%) and water (30%) mixture shield at the first 200 cm. The rear region of the inner steel frame without the mixture shield is filled with water. The mixture shield is penetrated by a 10 cm radius hole filled with water.

  • Fig. 3. Geometry and Features of the ITER Benchmark

An isotropic 14 MeV neutron source is located at 100 cm in front of the assembly. For the verification study, we have segmented the geometry with a unified 20 cm x 50 cm x 50 cm (27 x 4 x 4 voxel). The proposed R2S and the reference cell-based method were performed with the same number of voxels. As the problem features a bulk shield and streaming properties, both cell averaged F4 tallies and superimposed FMESH4 tallies have been calculated using the weight window (wwinp) calculated by ADVANTG code [5]. As expected, the high neutron fluxes occur near the source region while it decreases by about five orders of magnitudes near the rear surface. Fig. 4 shows the neutron flux map.

  • Fig. 4. Neutron Flux Map in the Assembly (𝑑𝑛−2 ∙ 𝑡−1)

As mentioned earlier, the statistical accuracy of the volume fraction depends on the number of PTRAC

  • events. Through the sensitivity study, the volume

fraction occupied by cells inside each voxel was

  • ptimized by adjusting the number of PTRAC events.

The volume fractions in the voxel calculated by the ray- tracing method were compared with those of the cells defined as the same sizes as the meshes used in the mesh-

  • tally. The maximum volume difference in each voxel

between the proposed and reference method was up to about 1.07% in cell 7 (see the right figure of Fig. 5).

  • Fig. 5. Difference of Maximum Volume Fractions

Transactions of the Korean Nuclear Society Virtual Spring Meeting July 9-10, 2020

slide-3
SLIDE 3

To calculate the shutdown dose rate, an irradiation history was set up to describe immediately after the 9- month decay after repeating the 9-month decay and the 3-month cooling 4 times. Fig. 6 compares the dose maps from the proposed mesh-based R2S and cell-based R2S methods.

Fig 6. Dose Maps from the Cell-based R2S (top) and Proposed Mesh-based R2S (bottom), Respectively (𝜈𝑇𝑤/ℎ).

Overall, the dose rate of the proposed mesh-based R2S method was higher than that of the reference cell-based R2S method. Generally, the mesh-based R2S approach tends to overestimate the gamma sources at the interface

  • f material with the void, such as the annular gap in this
  • study. This is due to the mismatch of voxel size with the

curved geometry regions. The benchmark dose rate tallies in the cylindrical shells among from 0 cm to 540 cm are shown in Fig. 7. The reference result was obtained by the cell-based R2S calculation.

  • Fig. 7. Dose rates in the Inner and Outer Regions for the

Proposed Mesh-based R2S and Reference Cell-based R2S

  • Fig. 7 shows that the proposed mesh-based R2S gives

almost similar dose rates in the front region existing the mixture shield while it overestimates the dose rates in the rear region. However, for more realistic problems, it is very difficult to model with fine-cells in order to get the tally distributions. This is because the inner voxel was averaged using the high energy neutrons streaming through the annular water hole. Also, the gamma dose rate at the outer steel region was increased, since outer void regions were used for averaging the neutron flux

  • distribution. The Figure Of Merit (FOM) of each method

was calculated to verity the improvement in the computational efficiency of the new mesh-based R2S approach compared to the reference cell-based R2S

  • approach. The FOM defined to be 1/(σ2𝑈), where σ2 is

the variance of the mean, 𝑈 is the computational time for all histories. The FOM of each approach was described as shown in Table I. Table I shows that FOM of the new mesh-based R2S is 6.7 times higher than FOM of the existing cell-based R2S.

Table I. The Figure of Merit each Method FOM Reference Cell-based R2S Method 3.5730E+04 New Mesh-based R2S Method 2.4197E+05

  • 3. Conclusions

In this study, the new mesh-based R2S approach was

  • proposed. The proposed mesh-based R2S approach with

mesh-tally capabilities is an extension of the existing cell-based R2S method. The method is based on total flux and neutron spectra on a voxel using mesh-tally in

  • MCNP5. The decay gamma sources for gamma transport

are generated by FISPACT calculations for voxel material composition and specific neutron intensity. From this verification shutdown dose rate benchmark calculations, it was shown that the proposed mesh-based R2S good agreements in shutdown dose rates with the reference cell-based R2S method in the front region having the mixture shield. However, when neutron flux distributions were considered, one can conclude the proposed mesh-based R2S is well functioning the rigorous-2-step method using a mesh tally. Also, the calculation efficiency was improved compared to existing cell-based R2S. The differences in a well- adjusted cell-based calculation can be understood by average calculation effects, geometry resolution, and the proper choice of voxel size. In the future study, we will include a more efficient and flexible materials treatment and voxel definitions of the more complex geometry. Acknowledgments This work was supported by the NRF (National Research Foundation of Korea) through Project No. NRF-2019M2D2A1A02057890, and Innovative Technology Center for Radiation Safety (iTRS). REFERENCES

[1] Y. Chen and U. Fischer, Rigorous MCNP based shutdown dose rate calculations: computational scheme, verification calculations and application to ITER, Fusion Engineering and Design, Vol. 63-64, p. 107-114, 2002. [2] X-5 Monte Carlo Team, MCNP-A General Monte Carlo N-Particle Transport Code, Version 5, Volume II: User’s Guide, LA-CP-03-0245, Los Alamos National Laboratory, 2003. [3] R. A. Forrest, FISPACT 2007 User Manual EASY 2010, UKAEA FUS, Vol. 534, 2007. [4] M. Loughlin, Conclusions of Shutdown Dose Rate Benchmark Study, 6th ITER Neutronics Meeting, Hefei, China, June 19–24, 2011. [5] S. W. Mosher et al, ADVANTG-An Automated Variance Reduction Parameter Generator, ORNL/TM-2013/416

  • Rev. 1, August, 2015.

Transactions of the Korean Nuclear Society Virtual Spring Meeting July 9-10, 2020