
SLIDE 1
Vapor Intrusion 2010 – Sept. 29-30 – Chicago
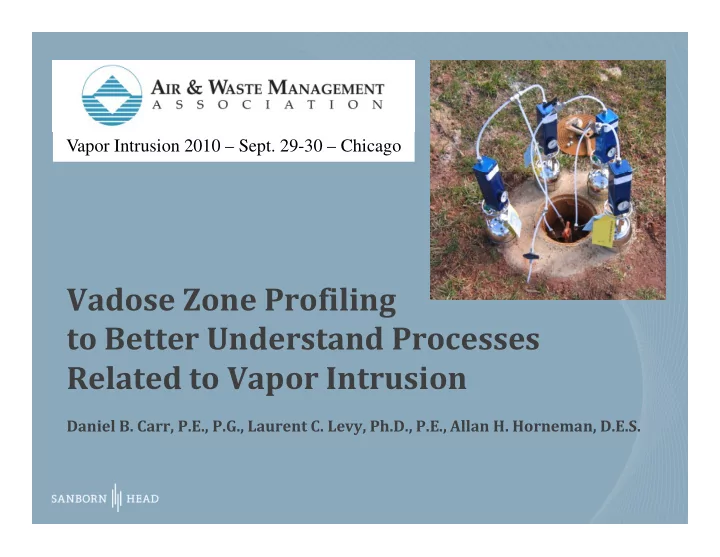
Vadose Zone Profiling g to Better Understand Processes Related to Vapor Intrusion Related to Vapor Intrusion
Daniel B. Carr, P.E., P.G., Laurent C. Levy, Ph.D., P.E., Allan H. Horneman, D.E.S.