
SLIDE 1
Luquillo Critical Zone Observatory Overview September 2009 How - - PowerPoint PPT Presentation
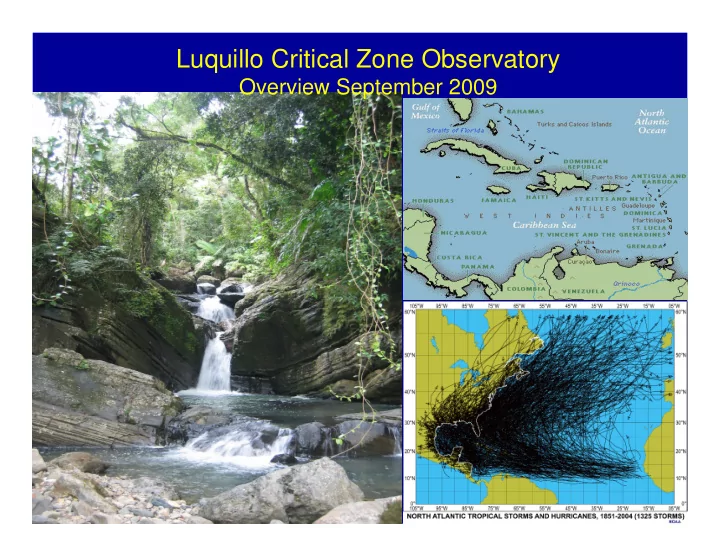
Luquillo Critical Zone Observatory Overview September 2009 How critical zone processes, water balances, and mass fluxes differ in landscapes with contrasting lithology but similar climatic and environmental histories How to Critical Zone
How to “Critical Zone Processes” Vary with Bedrock Lithology ?
7 General Hypothesis saprolite --- surface soils --- hillslopes/riparian zones --- transport & fluvial processes How critical zone processes, water balances, and mass fluxes differ in landscapes with contrasting lithology but similar climatic and environmental histories
Coastal Plain Alluvium
Rainfall Runoff 4 Lithologies X 4 Forest Types
Subtropical Dry to Wet life Zones 1000 mm/yr PET > Rainfall 5000 mm/yr Wetlands
Steepest Gradients dh/dl ~ 1000 m over 6km Rainfall ~ + 235 mm/yr/100 m Runoff ~ + 400 mm/yr/100 m
Biology “Highest Woody Plant Diversity” Disturbance 50 yr RI for direct hurricane impacts Landslides RI ~ 1-2 years Lithology ?? Time Eocene, no glaciations, oldest surfaces ?? Long-term environmental records “Old on the inside young on the outside”
Urban site with long environmental time series
USGS-WEBB + USFS-IITF + LUQ-LTER
– White, Buss, Shanley, Scholl, IITF…
– Brantley, White, Fletcher
– Scatena, Johnson, Jerolmack, Plante, Horton, Willenbring
– Kurtz: BU – Heimsath; ASU.. – Mayol: UPR – Porder: Brown – J. Pett-Ridge OSU
Hypothesis 1: The rate of saprolite advance varies with regolith thickness and landscape position and
is fastest in GD valleys and slowest on VC ridges. Over large areas, the rate of saprolite advance will equal the rate of denudation and can be predicted from bedrock chemistry, porefluids, and physical rock properties (Brantley, Buss, White, Heimsath, Willenbring,).
Hypothesis 2: In surface soils, chemical transformations of atmospheric inputs are decoupled from
bedrock lithology and influenced by soil carbon, surface redox, and plant nutrient cycling. Biotic influences on soil biogeochemistry decrease with storm intensity and soil depth and are greatest in surface soils of the VC during low intensity rainfalls (Johnson, Shanley, Silver, Scatena, UPR).
Hypothesis 3: The residence time and routing of water varies with bedrock lithology and will be longest
in areas underlain by the GD and shortest in areas underlain by VC. However these differences will decrease with storm intensity and duration (Scholl, Scatena, Shanley, McDowell).
Hypothesis 4: Over seasonal time scales, iron reduction and related CO2 production will be greatest
in VC surface soils and lowest at depth on stable GD ridge tops. Over large areas and longer time scales deep weathering rates and surface soils properties are closely linked to the frequency of low redox events and the magnitude of iron reduction (Silver, Brantley, Plante)
Hypothesis 5: The morphology, and soil biogeochemistry of riparian and colluvial deposits varies
systematically with lithology and in a downstream direction, while their vegetation and soil organic matter chemistry varies systematically with rainfall and temperature (McDowell, Plante, Silver, Scatena, Jerolmack).
Hypothesis 6: Sediment supply and transport within the stream channel network is dominated by
surface erosion associated with rainfalls of moderate intensity in the VC and landslides associated with high intensity events in the GD (Jerolmack, Horton, Willenbring, Scatena, Shanley).
Hypothesis 7: The depositional environments of coastal and fluvial sediments draining the GD will have
a higher resolution record of climatic disturbances and land use changes than corresponding environments in the VC (Horton, Willenbring, Jerolmack, Heimsath, Scatena).
Luquillo CZO Hypothesis
Sediment & solute Inputs to channel network
Soil Nodes
H1, H3
Aquatic nodes X-sections,
H5, H6
H2,H3
H3, H5
Channel Network & Transport H4,H5
Soils & Vegetation Hillslopes Catena’s
Bedrock lithology & Weathering Deep Nodes
Atmospheric inputs
Weather stations
Fluvial & Coastal Depositional Environments
Dating & Isotopes Scholl, Willenbring, Hemistath, Shroud Weathering; Brantley, White, Buss, Fletcher Soil & Vegetation Johnson, Silver Plante, Silver Scatena Atmospheric USFS & USGS, Scholl, Shanley Silver, Scatena Mayol & UPR
Streams; Jerolomack, McDowell, Scatena, Shanley Nutrient cycling Kurtz, Johnson, McDowell, Scatena, Silver
Sediment & solute Inputs to channel network
Soil Nodes
H1, H3
Aquatic nodes X-sections,
H5, H6
H2,H3
H3, H5
Channel Network & Transport H4,H5
Soils & Vegetation Hillslopes Catena’s
Bedrock lithology & Weathering Deep Nodes
Atmospheric inputs
Weather stations
Fluvial & Coastal Depositional Environments
Infrastructure Development “build it and they will come” Coordinated Sampling & Data Management
USGS, USFS, LTER, NOAA…
Weathering Nodes Deep Wells Lysmeters Soil Nodes Instrumented Quantitative Pits Aquatic Nodes 10 Stream Gages X-sections
Upgrade and standardize existing network supported by USGS WEBB, USFS IITF, and UCB at Icacos, Bisley and Sabana. Isotope samplers will be established as needed. Hourly & daily climate (precip, temp., radiation, RH, wind, soil moisture etc,) Periodic & event sampling of chemistry, stable isotopes
Atmospheric Climate Stations (E) (Shanley, Scholl, UPR)
Atmospheric Sampling Nodes
Rio Blanco estuary and coastal zone Mameyes estuary and coastal zone Short cores and surface samples
Coastal
(Horton)
Icacos (U1,2) Multiple sites along R. Blanco Bisley (U1,2) Multiple sites along R. Mameyes Piezometers, tensiometers, lysimeters & gas samplers, Periodic & event sampling
Riparian
(McDowell)
Icacos USGS 750 Guaba USGS 749 Rio Blanco USGS
USGS 655 (U1) Bisley Q1-3 (U2) USGS 660 (E) USGS 670 (E) Upgrade gages with permanent cross-sections (U1,2), bedload transport estimates (U1-3), Be10 denudation rates (N2-5) expand water sampling (U1), sensors for conductivity & temp (N1,2)
Fluvial
(Jerlomack, Scatena McDowell Shanley)
Aquatic Sampling Nodes
Guaba Ridge (U1) Guaba Slope (U1) Icacos Riparian (N2) Bisley Ridge (N1) Bisley Slope (N2) Bisley Riparian (N3) Quantitative pits & bore holes, SOM, total and extractable nutrients, X-ray, grainsize, hydrologic properties. Surface to bedrock Apogee oxygen sensors, trace gas, H20 content, samplers, Multiple quantitative soil pits at the intensive research sites and throughout the Luquillo Mountains, stratified by climate, bedrock, and land cover (N1-5)
Soil & Redox
(Johnson) (Silver)
Guaba Ridge (U1) Guaba Slope (U2) Icacos (N2) Bisley Ridge (N1) Bisley Slope (N2) Bisley Riparian (N3) Surface to bedrock lysimeters, tensiometers, & gas samplers. Periodic & event sampling, XRF, mineralogy, archived soils
Deep Weathering
(Brantley)
Soil and Deep Weathering Nodes (Terrestrial Nodes)
Granodiorite
(Guaba/ Blanco)
Volcaniclastic
(Bisley/Mameyes)
Infrastructure and Measurements Node
ideas, discoveries, or tools that radically change our understanding
ideas, discoveries, or tools that radically change our understanding
ideas, discoveries, or tools that radically change our understanding
ideas, discoveries, or tools that radically change our understanding
ideas, discoveries, or tools that radically change our understanding
ideas, discoveries, or tools that radically change our understanding
SOM Hurricane Dominated 110 yr Gap and slide Dominated 40 yr Saprolite thickness // channel
Rapid turnover in top 50-100 cm
Surface
Bedrock
Saprolite
TPI ~ 39% TPI + Age + Depth ~ 60% Vegetation type ~ 8%
Bisley Soils
1000 m ~ 500 m ~ lower Cumulus limit 2000 m ~ upper Cumulus limit
Sediment & solute Inputs to channel network
Soil Nodes
H1, H3
Aquatic nodes X-sections,
H5, H6
H2,H3
H3, H5
Channel Network & Transport H4,H5
Soils & Vegetation Hillslopes Catena’s
Bedrock lithology & Weathering Deep Nodes
Atmospheric inputs
Weather stations
Fluvial & Coastal Depositional Environments
Dating & Isotopes Scholl, Willenbring, Hemistath Weathering; Brantley, White, Buss, Fletcher Soil & Vegetation Johnson, Silver Plante, Silver Scatena Atmospheric USFS & USGS, Scholl, Shanley Silver, Scatena Mayol & UPR
Streams; Jerolomack, McDowell, Scatena, Shanley Nutrient cycling Kurtz, Johnson, McDowell, Scatena, Silver
SOC NPP Earthworms elevation
Cloud Coast
#/m2 Species/m2