Utahs Demographic Transformation: A View into the Future Utah State - - PowerPoint PPT Presentation

utah s demographic transformation
SMART_READER_LITE
LIVE PREVIEW

Utahs Demographic Transformation: A View into the Future Utah State - - PowerPoint PPT Presentation

Utahs Demographic Transformation: A View into the Future Utah State Board of Regents Utah State Board of Regents Russell C. Taylor Health Sciences Building Dixie State College March 26, 2009 Pamela S. Perlich, Ph.D. University of Utah


slide-1
SLIDE 1

Utah’s Demographic Transformation:

A View into the Future

Utah State Board of Regents Utah State Board of Regents

Russell C. Taylor Health Sciences Building Dixie State College March 26, 2009

Pamela S. Perlich, Ph.D. University of Utah

slide-2
SLIDE 2

Perlich, BEBR, University of Utah 2

slide-3
SLIDE 3

America’s Changing Population America s Changing Population

Confluence of four demographic trends are dramatically

transforming the American population transforming the American population

  • 1. Record numbers of immigrants – beginning in the 1980s and

continuing for the foreseeable future

  • 2. Aging of the Post WWII Baby Boomers
  • 3. Differential fertility levels and trends

I i lif t

  • 4. Increase in life expectancy

Perlich, BEBR, University of Utah 3

slide-4
SLIDE 4

Cumulative Impact “New Utah” p

Much more diversity along many dimensions

Age Age Nativity Culture Language Ethnicity S

i i

Socioeconomics

Perlich, BEBR, University of Utah 4

slide-5
SLIDE 5

Generational Shift Generational Shift

Youth of today are experiencing this increasing diversity,

while older generations have not. while older generations have not.

The nation is in the midst of an extraordinary demographic

transformation and embarking on a great multicultural i experiment.

Youth of today, as adults, will be asked to carry a greater

demographic burden than the generation of their parents demographic burden than the generation of their parents.

Changes are cumulative and irreversible. Changes are cumulative and irreversible.

Perlich, BEBR, University of Utah 5

slide-6
SLIDE 6

Overview Overview

U h

Utah context Regional growth trends I

i ti

Immigration Racial / Ethnic diversity Age structure Age structure A view into Utah’s future

Perlich, BEBR, University of Utah 6

slide-7
SLIDE 7

Ut h Si t D hi R i Utah: Signature Demographics Remain – But is Trending Toward the Nation

27 1 35.3 28 5 36.6 30 40 Median Age

2000 2007

27.1 28.5 20 30 Utah U.S. Utah U.S. Perlich, BEBR, University of Utah 7

Source: U.S. Bureau of the Census, various.

slide-8
SLIDE 8

Median Age at First Marriage: Median Age at First Marriage: Utah Trends Towards Nation

Perlich, BEBR, University of Utah 8

Source: U.S. Bureau of the Census, various.

slide-9
SLIDE 9

U.S. Boom U.S. Echo 2008 US Births Exceed 1957

Utah and U.S. Annual Births: 1940-2008

60 4 4.5

Peak: 1957 Peak: 1990 Exceed 1957

50 60

ds)

3 3.5 4

s)

30 40

irths (thousand

2 2.5 3

Births (millions

Utah US 10 20

Utah Bi

1 1.5

US B

Ut h B Ut h E h Ut h E h E h

10 1940 1950 1960 1970 1980 1990 2000 0.5

Utah Boom Peak: 1962 Utah Echo Peak: 1980-2 Utah Echo Echo Peak: 2012??

1940 1950 1960 1970 1980 1990 2000

Source: BEBR analysis of data from the Utah Population Estimates Committee and the National Center for Health Statistics (revised 1/2009).

Perlich, BEBR, University of Utah 9

slide-10
SLIDE 10

Utah & U.S. Annual Births:18 Years Prior

U.S. Peak: U S Trough:

60

4.5

U.S. Peak: 1975 1957 Birth Year 2008 Birth Year 1990 U.S. Trough: 1993 1973 Birth Year

50 60

3.5 4 4.5

30 40

(thousands)

2.5 3

s (millions)

Utah US 20 30

Utah Births

1.5 2

US Births

10

0.5 1

Utah Peak: 1979 1961 Birth Year Utah Peak: 2000 1982 Birth Year

1958 1968 1978 1988 1998 2008 2018

Perlich, BEBR, University of Utah 10

Source: BEBR analysis of data from the Utah Population Estimates Committee and the National Center for Health Statistics (revised 1/2009).

slide-11
SLIDE 11

Utah Population 18-24 Years Old: Historical & Projected Historical & Projected

500,000

18-24: High Economic Growth, High Fertility 18 24 B li

400,000

18-24: Baseline 18-24: Low Economic Growth, Low Fertility Cumulative Births 18-24 years prior Bureau of Census 2005 GOPB 2005

300,000 200,000

Age wave hits

100,000 1980 1985 1990 1995 2000 2005 2010 2015 2020 2025 2030

college age 2016 - 2025

Perlich, BEBR, University of Utah 11

1980 1985 1990 1995 2000 2005 2010 2015 2020 2025 2030

Source: Perlich and Reeve, “The Coming Boom in Utah’s School Age and College Age Populations,” Utah Economic and Business Review, 2002. BEBR analysis of data from the Utah Population Estimates Committee. Births updated 2/2008.

slide-12
SLIDE 12

Utah School Age Population: Historical & Projected Historical & Projected

900,000 High Economic Growth and Fertility 700 000 800,000 High Economic Growth and Fertility 2002 Baseline Low Economic Growth and Fertility 2005 GOPB Baseline 600,000 700,000 400 000 500,000 300,000 400,000 1980 1985 1990 1995 2000 2005 2010 2015 2020 2025 2030

Perlich, BEBR, University of Utah 12

1980 1985 1990 1995 2000 2005 2010 2015 2020 2025 2030

Sources: Perlich and Reeve, “The Coming Boom in Utah’s School Age and College Age Populations,” Utah Economic and Business Review, 2002; GOPB 2005 Baseline Projections.

slide-13
SLIDE 13

Utah Emerges as Part of a Net In-Migration Region Net In Migration Region

9 0

Until about 1970, Utah

Remained somewhat geographically isolated, as well as economically

specialized (extractive industries, federal government, etc.)

Was vulnerable to booms and busts of these industries and had

corresponding periods of in and out migration.

Since 1970, Utah (and the intermountain region) has Since 1970, Utah (and the intermountain region) has

Generated more rapid economic growth than the nation, Developed a more diversified economy, Become more fully integrated into the global economy, and Has emerged as a consistent net in-migration region.

Perlich, BEBR, University of Utah 13

slide-14
SLIDE 14

U.S. Population by Region: 1900-2030

160 140 160

  • About 2/3 of the national growth from 1900 to 2000
  • ccurred in the South and West.
  • West + South > 50% National Population by 1980.

100 120

sons

  • ccurred in the South and West.
  • Nearly 90% of the national growth

from 2000 to 2030 is projected to occur in the South and West.

80

ns of Pers

South West Midwest

in the South and West.

40 60

Million

Midwest Northeast

20

Perlich, BEBR, University of Utah 14

1900 1910 1920 1930 1940 1950 1960 1970 1980 1990 2000 2010 2020 2030

Source: U.S. Bureau of the Census 1995; 2000; 2005.

slide-15
SLIDE 15

Population in the Intermountain West: 1900 - 2030

10 12

Arizona and Colorado generated over half (53%) of of growth of the Mountain Division in the 20th century.

8 10

  • ns

Between 2000 and 2030, the populations of Arizona and Nevada are projected to double.

6

  • ns of Perso

Arizona Colorado Nevada U h 4

Millio

Utah New Mexico Idaho M t 2 Montana Wyoming

1900 1910 1920 1930 1940 1950 1960 1970 1980 1990 2000 2010 2020 2030

Perlich, BEBR, University of Utah 15

Source: U.S. Bureau of the Census 1995; 2000; 2005.

slide-16
SLIDE 16

Net Migration, Natural Increase, and Population Change: Annual Rates for Utah (1950-2008)

4% 5%

Net Migration Population Change Natural Increase

3%

Natural Increase

1% 2% 0% 1%

  • 1%
  • 2%

1950 1955 1960 1965 1970 1975 1980 1985 1990 1995 2000 2005

Perlich, BEBR, University of Utah 16

Source: BEBR, University of Utah Analysis of UPEC data.

slide-17
SLIDE 17

“I m m igrants Turn Utah i t Mi i M lti P t” into Mini-Melting Pot”

By Haya El Nasser, USA TODAY 9/ 15/ 2006 SALT LAKE CITY — In the shadow of the the shadow of the Mormon faith's majestic headquarters, the fountain at the center of h G Pl the Gateway Plaza

  • utdoor mall is a popular

backdrop for weddings. On a scorching day, g y, Hispanic and Anglo children run side by side through the pulsating f t

Perlich, BEBR, University of Utah 17

sprays of water.

slide-18
SLIDE 18

Perlich, BEBR, University of Utah 18

slide-19
SLIDE 19

U S Foreign Born Population: 1900 – 2007 U.S. Foreign Born Population: 1900 2007

38.1 25% n 40 45

Undocumented in 2005 = 11.1 million Milli

20% Population 30 35 40 (Millions)

  • r 31.1% of the foreign born

population and 3.8% of the total population Million

14.7% 12.6% 15% are of Total 20 25 30 reign Born ( 5% 10% n Born Sha 10 15 20 mber of For 0% 5% Foreig 5 Num

1900 1910 1920 1930 1940 1950 1960 1970 1980 1990 2000 2007

Perlich, BEBR, University of Utah 19

Sources: Bureau of the Census (decennial Censuses and 2007 American Community Survey), Pew Hispanic Center, BEBR Calculations.

slide-20
SLIDE 20

Utah Foreign Born Population: 1900 – 2007 Utah Foreign Born Population: 1900 2007

215 757

25% 250

U d t d i 2005 75 000 t

19% 18%

215,757

20% Population 200 housands)

Undocumented in 2005 = 75,000 to 100,000 or 39% to 52% of the foreign born population and 3% to 4% of total Utah population

13% 10% 15% are of Total 150 ign Born (Th 4% 4% 7% 8% 3% 4% 10% 6% 5% 10% gn Born Sha 50 100 mber of Fore 4% 3% 0%

1900 1910 1920 1930 1940 1950 1960 1970 1980 1990 2000 2007

Forei Num

1900 1910 1920 1930 1940 1950 1960 1970 1980 1990 2000 2007

Perlich, BEBR, University of Utah 20

Sources: Bureau of the Census (decennial Censuses and 2007 American Community Survey), Pew Hispanic Center, BEBR Calculations.

slide-21
SLIDE 21

State of Utah: Annual Net Migration International and Domestic: 2000-07 International and Domestic: 2000-07

30,000 35,000 Net I nternational Net Domestic Total 20,000 25,000 n 10,000 15,000 Net Migration 5,000 N (10,000) (5,000) 2000 2001 2002 2003 2004 2005 2006 2007

S U S B f th C P l ti E ti t P NST EST2007 lld t ST 99 7 St t P l ti

Perlich, BEBR, University of Utah 21

Source: U.S. Bureau of the Census, Population Estimates Program, NST-EST2007-alldata; ST-99-7 State Population Estimates and Demographic Components of Population Change: Annual Time Series, April 1, 1990 to July 1, 1999.

slide-22
SLIDE 22

Source Regions of Utah’s Foreign Born Population (2007) Utah s Foreign Born Population (2007)

Oceania Mexico Africa 2% North America 5% Latin American Europe 11% Ocea a 3% Mexico 46% Caribbean Asia 18% 54% South America 11% Caribbean 1% Central America Excluding Mexico 5% 18%

Perlich, BEBR, University of Utah 22

Source: U.S. Bureau of the Census, 2007 ACS.

slide-23
SLIDE 23

Nativity by Minority Status: Utah - 2000 y y y

Foreign Born Nati e Born Foreign Born

Balance 24%

Native Born

Minority 10% Minority 76% Balance 90%

Perlich, BEBR, University of Utah 23

Source: Bureau of the Census, 5% PUMS, Census 2000.

23

slide-24
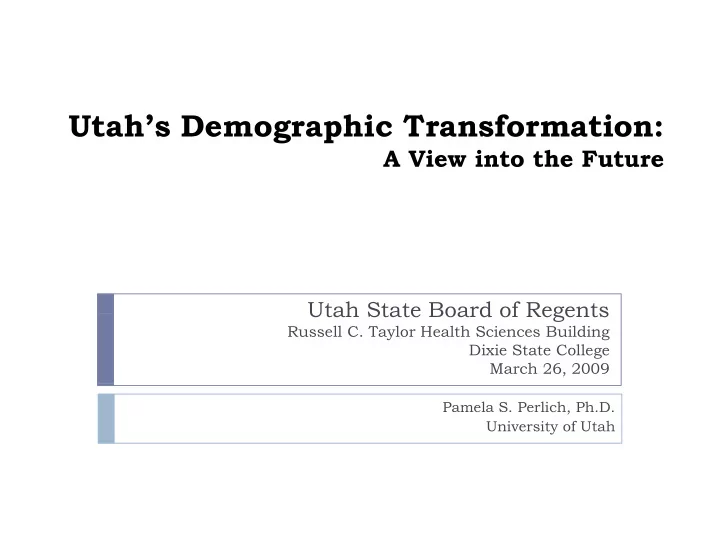
SLIDE 24

Utah’s Minority Population: 2007 Utah s Minority Population: 2007

Asian Alone (Not Hispanic)

  • Am. Indian &

Alaska Native Alone (Not Black or African American Native Hawaiian and Other Pacific (Not Hispanic), 50,453, 10% Alone (Not Hispanic), 30,595, 6% African American Alone (Not Hispanic), 25,179, 5% Other Pacific Islander Alone (Not Hispanic), 18,273, 4% , ,

18 0 % of

Other non- White (1)

18.0 % of population

Hispanic, 312,797, 65% White (1), 47,586, 10%

Note: Other non-White includes two or more races d S Oth R b th t Hi i (S

Perlich, BEBR, University of Utah 24

and Some Other Race, both not Hispanic (Source: BEBR Analysis of Bureau of Census and Utah Population Estimates data.)

slide-25
SLIDE 25

Minority Share of the Population: U.S., State of Utah, and Salt Lake County

45% 49% 54% 50% 60% 31% 34% 35% 40% 45%

41% 37% 34% 32%

40%

US Salt Lake County Utah

20% 24% 31%

27% 24% 19%

25% 27% 30% 30% 12% 11% 10% 10% 10% 11% 11% 17% 9%

19%

15% 17% 19% 22% 25% 10% 20% 2% 2% 2% 2% 1% 2% 2% 9% 6% 8% 0% %

1900 1910 1920 1930 1940 1950 1960 1970 1980 1990 2000 2007 2010 2020 2030 2040 2050 900 9 0 9 0 930 9 0 950 960 9 0 980 990 000 00 0 0 0 0 030 0 0 050

Perlich, BEBR, University of Utah 25

Sources: Bureau of the Census, Gibson and Jung (2002), Perlich (2002), BEBR computations using UPEC and BOC data. Note: Prior to 1970, minority is non-White. For 1970 and beyond, minority is non-White (may be Hispanic or non-Hispanic) plus Hispanic (may be of any race).

slide-26
SLIDE 26

Minority Share by Age Group – Utah and Salt Lake County: 2007

2% %

35%

3 31 29% 5% 26% 30% 27% %

30% Salt Lake County Utah 2007 Average State Share

25 22% 23% 19% 24% 23% 22% 19% 19% 23% 21% 18% 18%

20% 25%

1 16% 13% 13% 13% 12% % % 1 16% 1 15% 12% %

15%

11 10% 8% 11 10% 9% 8% 7% 7% 6%

5% 10% 0% 5%

< 5 5-9 10- 15- 20- 25- 30- 35- 40- 45- 50- 55- 60- 65- 70- 75- 80- 85+ 14 19 24 29 34 39 44 49 54 59 64 69 74 79 84

Perlich, BEBR, University of Utah 26

Sources: Bureau of the Census, 2007 Population Estimates.

slide-27
SLIDE 27

Utah Age & Sex Distributions x Nativity (2000)

80-84 85+

Foreign Born Native Born

80-84 85+ 60-64 65-69 70-74 75-79 80 8 60-64 65-69 70-74 75-79 80 8 35-39 40-44 45-49 50-54 55-59 35-39 40-44 45-49 50-54 55-59 10 14 15-19 20-24 25-29 30-34 10 14 15-19 20-24 25-29 30-34

15,000 5,000 5,000 15,000

< 5 5-9 10-14

120,000 60,000 60,000 120,000

< 5 5-9 10-14

Male Female Male Female

Source: U.S. Bureau of the Census, Census 2000, 5% PUMS.

Perlich, BEBR, University of Utah 27

slide-28
SLIDE 28

U.S. Minority Share by Age Group: 2010-2050

70%

54% 58% 62% 55%

60%

2010 2020 2030 2040 2050

45% 49% 40% 46% 50% 42%

40% 50%

35% 29% 35%

30% 40%

20% 24%

20% 10% 0%

Under 18 18 through 64 65 years and Older

Perlich, BEBR, University of Utah 28

Source: Bureau of the Census.

slide-29
SLIDE 29

Minority Contribution to Utah Population Growth Growth

1 9 9 0 -2 0 0 0 2 0 0 0 -2 0 0 7

Minority (All

Minority

Others) 33.4%

y (All Others) 34.7%

White Non- Hi i

White Non- Hi i

Hispanic 66.6%

Hispanic 65.3% Perlich, BEBR, University of Utah 29

Source: Bureau of Economic and Business Research Analysis of U.S. Bureau of the Census and Utah Population Estimates Committee data.

slide-30
SLIDE 30

Minority Contribution to Utah Population and School Enrollment Growth: 2000 to 2007 School Enrollment Growth: 2000 to 2007

Population Growth Enrollment Growth

Minority 33%

Minority 65%

White Non

White Non- Hispanic 35%

Non- Hispanic 67%

Perlich, BEBR, University of Utah 30

Source: Bureau of Economic and Business Research Analysis of U.S. Bureau of the Census, Utah Population Estimates Committee, and USOE data.

slide-31
SLIDE 31

Foreign Born Contribution to Population Growth: Utah and the US, 1990-2000 ,

Foreign Born 20%

Utah US

Foreign Born 35%

20%

Native Native Born 65%

Native Born 80% Perlich, BEBR, University of Utah 31

Source: U.S. Bureau of the Census, 2000 Census, Summary File 3; 1990 Census, STF3.

slide-32
SLIDE 32

US Population Growth: Immigrants, their Kids and their Grandkids are 80% to 2050 Kids, and their Grandkids are 80% to 2050

“If current trends continue, the population of

p p the United States will rise to 438 million in 2050, from 296 million in 2005, and 82% of the increase will be due to immigrants arriving from 2005 to 2050 and their U.S.-born descendants.”

Pew Research Center, 2008.

We are (and have always been) a nation of

immigrants.

Perlich, BEBR, University of Utah 32

immigrants.

slide-33
SLIDE 33

Top Occupations of Utah’s Foreign Born Top Occupations of Utah s Foreign Born

Assemblers & Fabricators Laborers / Material Movers, Cooks Retail Salespersons Cooks Retail Salespersons Maids,Housekeeping Customer Service Rep. Construction Laborers Waiters and Waitresses Janitors Truck Drivers Production Workers Carpenters Cashiers Postsecondary Teachers Cashiers Postsecondary Teachers Grounds Maintenance Workers

  • Misc. Agricultural Workers

Perlich, BEBR, University of Utah 33

Source: U.S. Bureau of the Census, Census 2000, 5% PUMS.

Perlich, BEBR, University of Utah

slide-34
SLIDE 34

Top Occupations Concentration Ratios

  • f Utah’s Foreign Born
  • f Utah s Foreign Born

Medical Scientists Maids and Housekeepers Packaging Machine Operators Fence Erectors Plasterers & Stucco Masons Sewing Machine Operators Plasterers & Stucco Masons Sewing Machine Operators Chefs and Head Cooks Misc.Assemblers

  • Misc. Media Workers

Woodworking Mach. Ops. Grinding, etc. Machine Ops. Astronomers & Physicists Dishwashers Drywall Installers Baggage Porters Dancers & Choreographers

Perlich, BEBR, University of Utah

gg g g p

34

Source: U.S. Bureau of the Census, Census 2000, 5% PUMS.

slide-35
SLIDE 35

Utah Educational Attainment by Nativity: Males 25 Years and Older (2000) Males 25 Years and Older (2000)

21 7% 30.5% 29.7%

College Graduate or

Total Native Born 18.2% 27.8% 21.7%

g Greater

Foreign Born Naturalized Not a Citizen 75.1% 62.1% 89.8% 87.2%

High School or Greater

54.5% 10.2% 12.8%

Less than High

45.5% 24.9% 37.9% 10.2%

Less than High School

Source: Bureau of Economic and Business Research - Analysis of Census 2000 5% PUMS

0% 20% 40% 60% 80% 100%

Research - Analysis of Census 2000, 5% PUMS

35 Perlich, BEBR, University of Utah

slide-36
SLIDE 36

Utah Educational Attainment by Nativity: Females 25 Years and Older (2000) Females 25 Years and Older (2000)

22.0% 21.9%

College Graduate

Total Native Born 21.2% 21.0% 21.1% 22.0%

College Graduate

  • r Greater

Native Born Foreign Born Naturalized Not a Citizen 77.9% 67.2% 90.1% 88.1%

High School or Greater

60.3% 77.9% 9 9% 11.9%

Less than High

39.7% 22.1% 32.8% 9.9%

Less than High School

Source: Bureau of Economic and Business Research - Analysis of Census 2000 5% PUMS

0% 20% 40% 60% 80% 100%

Research - Analysis of Census 2000, 5% PUMS

36 Perlich, BEBR, University of Utah

slide-37
SLIDE 37

Utah Age & Sex Distributions: 1900 & 2050

1900 2050

70-74 75+

1900 2050

70 74 75+ 50-54 55-59 60-64 65-69 70-74 50-54 55-59 60-64 65-69 70-74 30-34 35-39 40-44 45-49 50 54 30-34 35-39 40-44 45-49 50-54 10-14 15-19 20-24 25-29 30 3 10-14 15-19 20-24 25-29 30 34

  • 8%
  • 4%

0% 4% 8%

< 5 5-9

  • 8.0%
  • 4.0%

0.0% 4.0% 8.0%

< 5 5-9

Perlich, BEBR, University of Utah 37

Male Female Male Female

Sources: BEBR, University of Utah, 2008 Baseline Projections (2050) and U.S. Bureau of the Census (1900).

slide-38
SLIDE 38

http: / / home.business.utah.edu/ bebrpsp/ URPL5020/ Demog/ Pyramids/ StatePyramidLong.htm

Perlich, BEBR, University of Utah 38

slide-39
SLIDE 39

Perlich, BEBR, University of Utah 39

slide-40
SLIDE 40

Perlich, BEBR, University of Utah 40

slide-41
SLIDE 41

Perlich, BEBR, University of Utah 41

slide-42
SLIDE 42

Selected Age Group Projections for State of Utah: School Age, 60 and Over, and 65 and Older

1,133,594

1,200,000 Less than 5 years old 5 through 17 years old 60 years and older

998,411 899 392

1,000,000 60 yea s a d o de 65 years and older 85+

60+ > 5-17

509,092 899,392

600,000 800,000

422,550 254,031

400,000

177,255 22,064

200,000 2000 2005 2010 2015 2020 2025 2030 2035 2040 2045 2050

Perlich, BEBR, University of Utah 42

Sources: BEBR, University of Utah, 2008 Baseline Projections.

slide-43
SLIDE 43

Selected Age Group Projections for the U.S: School Age, 60 and Over, and 65 and Older

120,000,000 Less than 5 years old 5 through 17 years old 60 years and older

2009: 60+ > 5-17

80,000,000 100,000,000 60 years and older 65 years and older 85+

53,159,113

60,000,000

45,971,632 35,107,491

40,000,000

19,197,434 4,295,943

20,000,000 2000 2005 2010 2015 2020 2025 2030 2035 2040 2046

Perlich, BEBR, University of Utah 43

Source: U.S. Bureau of the Census

slide-44
SLIDE 44

65 and Older as a Share of the Population: U.S., Utah, and Salt Lake County

20%

21% 23%

U.S. Utah

18% 20%

17% 19%

Salt Lake County

12%

13% 15%

9%

9% 11%

8%

5% 7% 2000 2005 2010 2015 2020 2025 2030 2035 2040 2045 2050

Perlich, BEBR, University of Utah 44

Sources: U.S. Bureau of the Census, and BEBR, University of Utah, 2008 Baseline Projections.

slide-45
SLIDE 45

State of Utah Dependency Ratios

15 9 68 4 71.7 73.7 76.5 86.8 82.2

80 90

65 years and over Under 18

14.3 14.7 18.6 23.7 27.3 33.8 15.9 68.4 66.0

60 70

66 4

40 50

66.4 54.1 51.3 53.1 50.0 49.3 53.0

20 30 10

1990 2000 2010 2020 2030 2040 2050 1990 2000 2010 2020 2030 2040 2050

Sources: BEBR, University of Utah, 2008 Baseline Projections.

Perlich, BEBR, University of Utah 45

slide-46
SLIDE 46

U.S. Dependency Ratios

74.9 76.0 76.4

80 90

65 years and over Under 18

33.8 35.3 35.6 62.0 61.6 59.3 66.6

60 70

Under 18

20.1 20.7 26.7 20.0

40 50

42.0 41.5 38.6 39.9 41.1 40.8 40.8

20 30 10

1990 2000 2010 2020 2030 2040 2050 1990 2000 2010 2020 2030 2040 2050

Sources: U.S. Bureau of the Census, 2008 Baseline Projections.

Perlich, BEBR, University of Utah 46

slide-47
SLIDE 47

Utah is Forever Changed Utah is Forever Changed

Utah is in the midst of a cultural, economic, and

, , demographic transformation

Labor market conditions continue to bring people to

Utah Utah

Immigrants are a major part of the story Educational attainment and occupational distributions among

immigrants are concentrated in the high and low ends.

Diversity: increasing through migration and births Population is aging Population is aging

People live longer Baby Boom retirees

Perlich, BEBR, University of Utah 47

slide-48
SLIDE 48

The New Utah The New Utah

Implications for: Implications for:

Public sector programs / services Economic growth / development

Younger age groups are more culturally, ethnically,

economically, and linguistically diverse than older age groups groups

Population in older age groups is growing rapidly Youth of today will be the “sandwich” generation of Youth of today will be the sandwich generation of

tomorrow.

Perlich, BEBR, University of Utah 48

slide-49
SLIDE 49

Planning for the New Utah Planning for the New Utah

Intergenerational transfers

Invest in the education of today’s more diverse youth today Invest in the education of todays more diverse youth today –

more costly (technology and language)

This creates the most productive generation ever This develops the capacity of a new generation to support the

aging Baby Boomers as well as themselves.

Li

bl C iti

Livable Communities

Plan and build communities today to accommodate a much more

diverse population: age, culture, nativity, economic circumstance, p p g y mobility, language, etc.

Utah has begun a new era of diversity, with new challenges

d i i

Perlich, BEBR, University of Utah 49

and opportunities.

slide-50
SLIDE 50

Contact Information Contact Information

Pamela S. Perlich, Ph.D. Senior Research Economist Bureau of Economic and Business Research University of Utah www.bebr.utah.edu Pam.Perlich@utah.edu Voice: 801.581.3358 Fax: 801.581.3354

Perlich, BEBR, University of Utah 50