
SLIDE 1
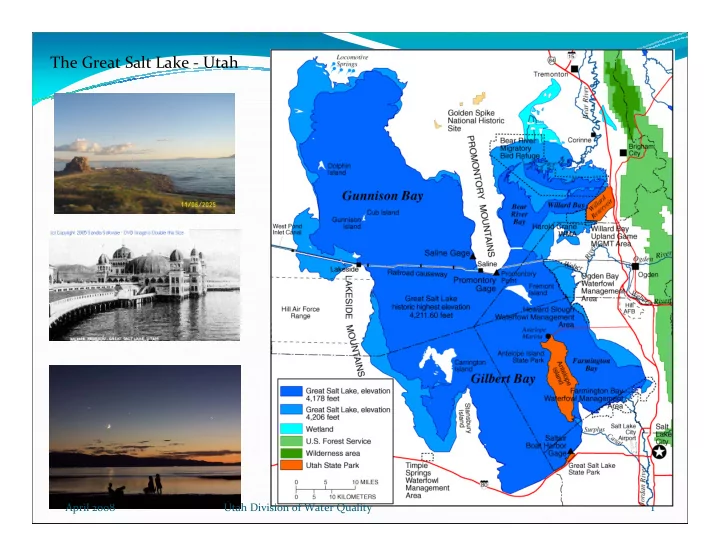
The Great Salt Lake ‐ Utah
April 2008 1 Utah Division of Water Quality
The Great Salt Lake Utah April 2008 Utah Division of Water Quality - - PowerPoint PPT Presentation
The Great Salt Lake Utah April 2008 Utah Division of Water Quality 1 April 2008 Utah Division of Water Quality 2 R.O. Brines Pipeline R.O. Brines Pipeline April 2008 Utah Division of Water Quality 3 Wildlife Selenium Problem Wildlife Selenium
The Great Salt Lake ‐ Utah
April 2008 1 Utah Division of Water Quality
April 2008 2 Utah Division of Water Quality
April 2008 3 Utah Division of Water Quality
Kesterson Reservoir California – 1980’s
Subsurface agricultural drainage water was
used for marsh management in Merced County, CA.
Inflow Avg. ~300 µg/L selenium. All fish except mosquitofish disappeared. Selenium‐induced effects, including dead
in 39% of the nests.
Many dead birds were found.
April 2008 4 Utah Division of Water Quality
[Might this be happening here?]
Brine Flies & Brine Shrimp Birds Chicks Stunted Growth Teratogenesis
April 2008 5 Utah Division of Water Quality
13 and 14 day 13 and 14 day‐ ‐old avocet chicks from clean and
seleniferous environments prior to hatching with same seleniferous environments prior to hatching with same diet after hatching. diet after hatching.
April 2008 6 Utah Division of Water Quality
Gadwall (Kesterson Reservoir, California) with arrested development of lower bill, spoonbill narrowing of upper bill, and missing eyes
(from Seiler et al. 2003) (from Seiler et al. 2003)
April 2008 7 Utah Division of Water Quality
Water to aquatic plants (algae) or invertebrates (brine
shrimp) often 1000X waterborne concentration.
Function of chemical form (organic>selenite>selenate). Ingestion is the main uptake pathway.
April 2008 8 Utah Division of Water Quality
Spiking Round Robin (EPA $15,000 grant)
Concentration Instrument
April 2008 9 Utah Division of Water Quality
Inductively Coupled Plasma Mass Spectrometer
April 2008 10 Utah Division of Water Quality
I CP I CP-
MS with Dynamic
Reaction Cell (DRC) [P&E]
April 2008 11 Utah Division of Water Quality
April 2008 12 Utah Division of Water Quality
1 2 3 4 5 6 USGS Hydride ACZ Hydride Kennecott Hydride Agilent ICPMS Collision Frontier Hydride USGS Collision Cell PE ICPMS DRC 0.5 1 1.5 2 2.5 3 3.5 4
Concentration of Se in Gilbert Bay @ USGS Site
USGS Hydride ACZ Hydride Kennecott Hydride Agilent ICPMS Collision Frontier Hydride USGS Collision Cell PE ICPMS DRC
ACZ Laboratories and USGS both reported values <1.0 ppb. 1 Meter Depth 7 Meter Depth
1 m Avg: 0.57 ug/l 7 m Avg: 0.74 ug/l April 2008 13 Utah Division of Water Quality
Anne Fairbrother, Ph.D. ‐ EPA / Parametrix, Seattle, WA Joseph Skorupa, Ph.D. ‐ US Fish & Wildlife Service, Washington, D.C. Theresa Presser, Ph.D. ‐ US Geological Survey, Menlo Park, CA William Wuerthele ‐ EPA / Consultant, Denver, CO Theron Miller, Ph.D. ‐ Utah Division of Water Quality, Park City, UT William Adams, Ph.D. ‐ Rio Tinto (Kennecott), Salt Lake City, UT Brad Marden – Artemia Assoc. / Parliament, Ogden, UT Don Hayes, Ph.D. – Univ. of Louisiana (Lafayette), Lafayette, LA William Moellmer, Ph.D. – Utah Division of Water Quality, SLC, UT Harry Ohlendorf, Ph.D. – CH2M‐Hill, Sacramento, CA [Consultant]
EC10 EC10
4/22/2008 15 Great Salt Lake Selenium Initiative
6.4 mg/kg 12.5 mg/kg 16.5 mg/kg
Poster 7
April 2008 16
April 2008 17
Selenium-Induced Teratogenesis in Nature
L
e spo nse Curve s
Egg Selenium Concentration (mg/kg, dry wgt.) Probability of Teratogenic Embryo 20 40 60 80 100 120 0.0 0.2 0.4 0.6 0.8 1.0
DUCK N=197 STILT N=931 AVOCET N=868
Logistic response curves for selenium‐induced teratogenesis among black‐necked stilt, American avocet, and duck eggs exposed to agricultural drainage water.
April 2008 18 Utah Division of Water Quality
Projects 1 & 2
Inputs Output to atmosphere via vapor phase Output to sediment via permanent burial Output, bioaccumulation, and toxicological endpoints in food chain
Project 3 Project 4
Is the chemistry such as that the concentration of Se in the lake is independent of input sources?
April 2008 19 Utah Division of Water Quality
Michael Conover, PhD [USU] John Cavitt, PhD [Weber State]
April 2008 20 Utah Division of Water Quality
April 2008 21 Utah Division of Water Quality
Wayne Wurtsbaugh, PhD [USU] Brad Marden [Parliament
Fisheries and the Artemia Association]
April 2008 22 Utah Division of Water Quality
April 2008 23 Utah Division of Water Quality
Dave Naftz, PhD [USGS] Bill Johnson, PhD [UofU]
April 2008 24 Utah Division of Water Quality
April 2008 25 Utah Division of Water Quality
Bill Johnson, PhD [UofU] Dave Naftz, PhD [USGS]
April 2008 Utah Division of Water Quality 26
ebullition volatilization
Ebullition:
quadrupole mass spectrometry
for total organic carbon and total Se
April 2008 27 Utah Division of Water Quality
Water Algae Brine Shrimp & Brine Flies Bird Egg (Critical Endpoint)
Brine Shrimp
If the water in GSL were at “x” ug/L what does the model predict the concentration of selenium would be in the egg?
ppb = parts per billion ppm = parts per million Water: ug/L (ppb) Bird Egg: mg/kg (ppm) 0.60 2.53 1.0 4.32 2.0 8.80 3.0 13.3
Black-Necked Stilt
Project 1 $312,900 Project 2 $163,300 Project 3 $213,600 Project 4 $347,000 Program Support $198,700 Undefined Support for ’07/’08 $106,200 Subtotal $1,341,700 USGS Matching Funds $124,000 Additional Cost [Science Panel] $1,000,000 Total Costs ~ $2,650,000
April 2008 30 Utah Division of Water Quality
Utah Division of Water Quality May 2008
Protecting the Individual
No Effect Concentration: NEC
Position of US Fish & Wildlife Service [USFWS]
Migratory Bird Act & Endangered Species Act
Protecting the Population
Effective Concentration: EC
Position of US Environmental Protection Agency [EPA]
Clean Water Act
Utah Water Quality Standards
Enforcement
(1)Should a standard be developed to protect the individual, or (2)Should a standard be developed to protect the population?
Greatest concentration or amount of a substance, found
by experiment, observation, or statistical regression that causes no alteration of morphology, functional capacity, growth, development or life span of target organism.
Position of the US Fish and Wildlife Service
Protect the individual bird
water quality standards
Concentration or amount of a substance,
found by experiment or observation, that causes an allowable alteration of morphology, functional capacity, growth, development or life span of target organisms distinguishable from those observed in normal (control) organisms of the same species and strain under the same defined conditions of exposure.
Position of the US Environmental Protection Agency [EPA]
Protect the Population
EC20 used on previous WQ Standards nationwide EC10 used on Great Lakes Initiative [rich data source]
Data Rich and Tissue Based Standard
Under Clean Water Act responsible for development of water quality
standards
Matrix: Bird Egg Frequency: Nesting season Measured as: Geometric Mean Range:
The Panel: 6.4 – 16.5 mg/kg (ppm) As Individual Panel Members:
5 mg/kg
1 Panel Member
10.4 mg/kg
1 Panel Member
12 – 13 mg/kg
6 Panel Members
Assessment Methodology
Monitor and Evaluate the Status of Bird Eggs and the Ecosystem Act with more aggressive monitoring and initiate DWQ action when the
concentration of Se in the eggs increase.
American Avocet
Matrix: Bird Egg Frequency: Nesting season Measured as: Geometric Mean Range:
As Individual Steering Committee Members:
5 mg/kg
5 Panel Members
10.4 mg/kg
1 Panel Member
12 – 13 mg/kg
10 Panel Members
Assessment Methodology
Monitor and Evaluate the Status of Bird Eggs and the Ecosystem Act with more aggressive monitoring and initiate DWQ action when the
concentration of Se in the eggs increase.
American Avocet
5 mg/kg 10.4 mg/kg 12.5 mg/kg
Tissue based Shorebird egg Dry weight Over the nesting season
Included as a part of the standard