User Popula,ons Forgo=en usernames/ Distributed across networks; - - PowerPoint PPT Presentation

user popula ons
SMART_READER_LITE
LIVE PREVIEW

User Popula,ons Forgo=en usernames/ Distributed across networks; - - PowerPoint PPT Presentation

User Popula,ons Forgo=en usernames/ Distributed across networks; LOW-RATE passwords the network being monitored DISTRIBUTED sees only a few hits BRUTEFORCERS LEGITIMATE SINGLETON USERS BRUTEFORCERS Have past history of Have a high rate


slide-1
SLIDE 1

User Popula,ons

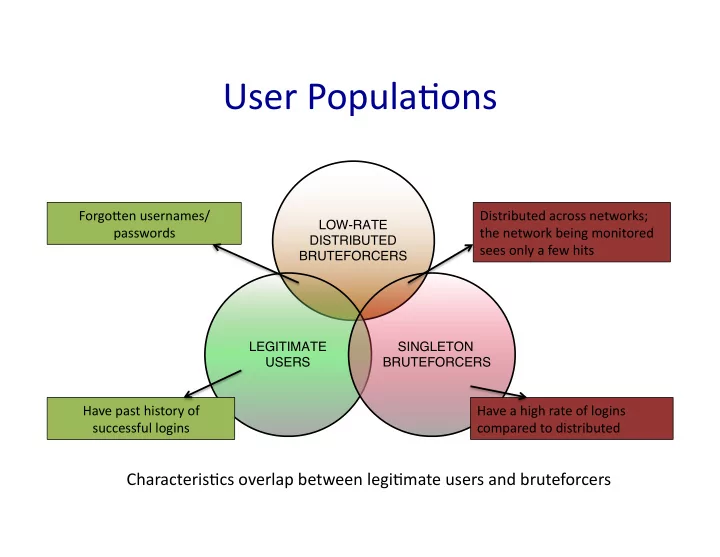
LOW-RATE DISTRIBUTED BRUTEFORCERS LEGITIMATE USERS

SINGLETON

BRUTEFORCERS

Characteris,cs overlap between legi,mate users and bruteforcers

Have past history of successful logins Forgo=en usernames/ passwords Distributed across networks; the network being monitored sees only a few hits Have a high rate of logins compared to distributed

slide-2
SLIDE 2

2

slide-3
SLIDE 3

3

slide-4
SLIDE 4
  • Site-wide parameter

– Global Failure Indicator (GFI)

  • Site-wide number of

failed logins per batch

  • f n logins
  • GFI well-modeled as

Beta–binomial

– Binomial with beta- prior on probability of success

Aggregate Site Analyzer

slide-5
SLIDE 5
  • Site-wide parameter

– Global Failure Indicator (GFI)

  • Site-wide number of

failed logins per batch

  • f n logins
  • GFI well-modeled as

Beta–binomial

– Binomial with beta- prior on probability of success

Aggregate Site Analyzer

slide-6
SLIDE 6
  • Site-wide parameter

– Global Failure Indicator (GFI)

  • Site-wide number of

failed logins per batch

  • f n logins
  • GFI well-modeled as

Beta–binomial

– Binomial with beta- prior on probability of success

Aggregate Site Analyzer

10 20 30 40 50 0.00 0.02 0.04 0.06 0.08 0.10 0.12 Number of failed logins per 100 logins PDF

  • ● ● ● ● ●
  • ● ● ● ● ● ● ●
  • ● ● ● ● ● ●
  • 2005

2006 2007 2008 2009

10 20 30 40 50 0.00 0.05 0.10 0.15

Beta−binomial fit Binomial fit Test data

slide-7
SLIDE 7

Aggregate Site Analyzer

Monitoring for Change (CUSUM Algorithm)

C0 = 0 Cn = max(0,Cn−1 + Xn − µ − k)

!! Xn −Random!variable!(GFI) µ! 3 !Mean!under!normal!behavior k! 3 !Parameter!based!on!magnitude!of!change! !!!!!!!to!be!detected

120 125 130 135 140 145 150 2 4 6 8 Sample No. (n) Test Statistic Cn

h

Scope of the a=ack

Cn > h

slide-8
SLIDE 8

Aggregate Site Analyzer

Monitoring for Change (CUSUM Algorithm)

C0 = 0 Cn = max(0,Cn−1 + Xn − µ − k)

!! Xn −Random!variable!(GFI) µ! 3 !Mean!under!normal!behavior k! 3 !Parameter!based!on!magnitude!of!change! !!!!!!!to!be!detected

120 125 130 135 140 145 150 2 4 6 8 Sample No. (n) Test Statistic Cn

h

Scope of the a=ack

Cn > h

Modeled CuSum process as Markov chain

slide-9
SLIDE 9

Aggregate Site Analyzer

Monitoring for Change (CUSUM Algorithm)

C0 = 0 Cn = max(0,Cn−1 + Xn − µ − k)

!! Xn −Random!variable!(GFI) µ! 3 !Mean!under!normal!behavior k! 3 !Parameter!based!on!magnitude!of!change! !!!!!!!to!be!detected

120 125 130 135 140 145 150 2 4 6 8 Sample No. (n) Test Statistic Cn

h

Scope of the a=ack

Cn > h

Modeled CuSum process as Markov chain Provides principled Time-to-Detection / FPR in terms of in-control /

  • ut-of-control Average

Run Length (ARL)

slide-10
SLIDE 10

Evalua,on

Total number of a.acks 99 Number of false a=acks 9

Determined by A=ack Par,cipants Classifier

Number of a.ack hosts 9,306 Number of false a=ack hosts 37 A=ack Par,cipants Classifier Aggregate Site Analyzer

Determined by future successful ac,vity/ Site Incident Database

slide-11
SLIDE 11

Characteriza,on of A=acks

Overlap of a=ack sources over different a=acks

  • 2000

4000 6000 8000 Anonymized remote network address May 2006 Sep 2006 Jan 2007 May 2007 Sep 2007 Jan 2008 May 2008 Sep 2008 Jan 2009 May 2009 Sep 2009 Jan 2010 May 2010 Sep 2010 Jan 2011 May 2011 Sep 2011 Jan 2012 May 2012 Sep 2012

90 a=acks cons,tuted a total of 35 a=ack campaigns

slide-12
SLIDE 12

A=ack Campaign Stealthiness

  • Point-wise Host detector (0/35)

(On average 2 a=empts per local machine per hour

  • Point-wise Network detector

(31/35 – Par,ally detectable)

High-rate hourly ac,vity in total number of failed a=empts/ number

  • f local hosts contacted
  • Undetectable by any point-wise detector (4/35)

Two of the campaigns succeeded in breaking-in; one undetected by the site

DETECTION COMPARISON

slide-13
SLIDE 13

13

slide-14
SLIDE 14

> Half of the campaigns do not appear in any

  • ther dataset

Indiscriminant vs. Targeted A=acks

0e+00 1e+05 2e+05 3e+05 4e+05 5e+05 6e+05 7e+05 5000 10000 Number of seconds elapsed since Oct 28 16:16:37 PDT 2009 Attempt No.

NATLAB HONEY

1 2 3 4 6 7 8 9 10 11 12 24 25 26 29 30 HONEY CAMPOFF RSRCHLAB

Attack Number Percentage overlap 20 40 60 80 100

One stealthy a=ack specifically targeted LBNL

  • Valid site usernames
  • Each remote host made only 9 a=empts

and contacted 3 local servers per hour

slide-15
SLIDE 15
slide-16
SLIDE 16
slide-17
SLIDE 17
slide-18
SLIDE 18
slide-19
SLIDE 19
slide-20
SLIDE 20
slide-21
SLIDE 21

IP Header Side Channel

4-bit Version 4-bit Header Length 8-bit Type of Service (TOS)

16-bit Total Length (Bytes) 16-bit Identification

3-bit Flags

13-bit Fragment Offset

8-bit Time to Live (TTL)

8-bit Protocol 16-bit Header Checksum 32-bit Source IP Address 32-bit Destination IP Address Payload

ID field is supposed to be unique per IP packet. One easy way to do this: increment it each time system sends a new packet.

slide-22
SLIDE 22

SYN-ACK

slide-23
SLIDE 23

SYN-ACK

slide-24
SLIDE 24

SYN-ACK

slide-25
SLIDE 25

SYN-ACK

slide-26
SLIDE 26

SYN-ACK

Spoofed

slide-27
SLIDE 27

SYN-ACK

slide-28
SLIDE 28

SYN-ACK

slide-29
SLIDE 29

SYN-ACK

Upon receiving RST, Patsy ignores it and does nothing, per TCP spec.

slide-30
SLIDE 30

SYN-ACK

slide-31
SLIDE 31

SYN-ACK

slide-32
SLIDE 32

SYN-ACK

slide-33
SLIDE 33

SYN-ACK

Spoofed

slide-34
SLIDE 34

SYN-ACK

slide-35
SLIDE 35

SYN-ACK