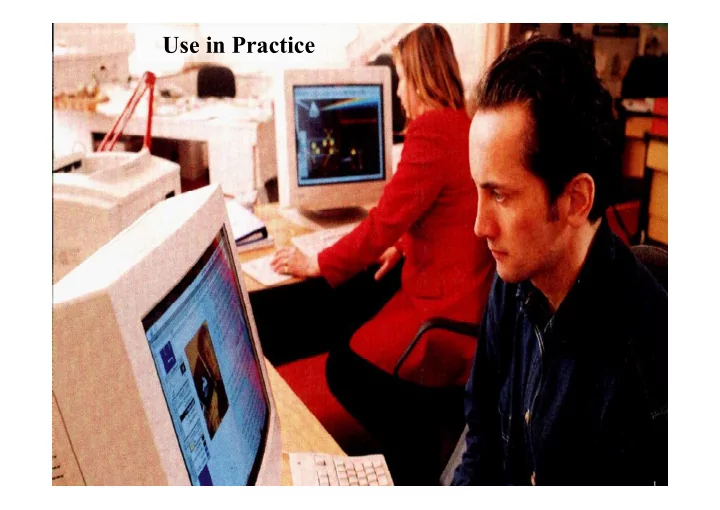
Use in Practice 1 Simulation goals High integrity representation - - PowerPoint PPT Presentation

use in practice
SMART_READER_LITE
LIVE PREVIEW

Use in Practice 1 Simulation goals High integrity representation - - PowerPoint PPT Presentation

Use in Practice 1 Simulation goals High integrity representation of the dynamic, connected and non-linear physical processes that govern the different performance aspects that impact on the overall acceptability of buildings and their


slide-1
SLIDE 1

Use in Practice

1

slide-2
SLIDE 2

Simulation goals

 High integrity representation of the dynamic, connected and non-linear physical processes that govern the different performance aspects that impact

  • n the overall acceptability of buildings and their

energy supply systems, existing or planned.  Performance domain conflation to represent the interactions and conflicts that occur between problem parts and give rise to the need for practitioners to make performance trade-offs.  Design process integration to embed high fidelity tools within work practices in a manner that adds value and, in the long term, supports virtual design through the interactive manipulation of a design hypothesis with performance feedback in real time.

2

slide-3
SLIDE 3

Virtual design benefits

Integrated simulation helps practitioners to:

  • conform to legislative requirements;
  • provide the requisite levels of comfort;
  • attain indoor air quality standards;
  • embody high levels of new and RE technologies;
  • incorporate innovative EE & DSM solutions;
  • lessen environmental impact.

Defines a new best practice:

  • respects temporal aspects and interactions;
  • integrates all technical domains;
  • supports co-operative working;
  • links life cycle performance to health & environmental impact;
  • use set to expand in Europe with the advent of the EPBD.

The approach is rational:

  • gradual evolution of the problem description;
  • action taken against performance outputs at discrete stages.

3

slide-4
SLIDE 4

Components of an integrated energy simulation program

Issues: database maintenance; project management; problem abstraction.

4

slide-5
SLIDE 5

5

Simulation in design: behaviour follows description

pre-constructed dbs performance indicators + geometry spec. visualisations, shading etc + constructional embodied energy etc + operational data energy demand profiles etc + boundary conditions ‘no-system’ comfort etc + special materials PV, switchable glazings etc + control systems energy use, system response etc + flow network ventilation, heat recovery etc + HVAC network component sizing, systems design etc IAQ, comfort, ventilation  etc + CFD domain + power network DSM, RE integration etc + enhanced resolution thermal bridging etc + moisture network condensation, mould & health

slide-6
SLIDE 6

Incremental model building - effort and reward

increasing effort

6

slide-7
SLIDE 7

Problem abstraction: high resolution

7

slide-8
SLIDE 8

Automatic inclusion of content and plant entities in visualisations and daylight utilisation studies.

8

slide-9
SLIDE 9

IAQ: mean age of air Consideration of comfort and well- being. thermal bridging & mould Thermal comfort Smoke extract

9

slide-10
SLIDE 10

Boiler efficiency, combustion chamber temperature and boiler flow/return water temperature corresponding to a typical start-up event – water temperature rises from ~20 C to 80 C, followed by on/off cycling.

10

slide-11
SLIDE 11

Combustion chamber temperature distribution snapshots corresponding to different levels of stoichiometric excess air.

11

slide-12
SLIDE 12

Fluctuation of power between the consumer and LV network and significant power export (-ve power) indicates the need for load control. Summer day import/ export for the 4 kW PV array.

12

slide-13
SLIDE 13

Voltage excursions with power import/ export. Supply voltage, 200 dwellings. With PV

13

slide-14
SLIDE 14

Impact on heating load of additional thermal mass for a given temperature set-point (solid line). Impact of occupant behaviour

  • n room temperature.

No additional mass With occupant behaviour

14

slide-15
SLIDE 15

database of actual & future consumption metered energy use

scenario simulations

information for government, local authorities, institutions, industry, utilities, designers, planners, citizens and others interrogations consumption & emissions monitoring; city profiling & property classification; trend analysis & action planning e-services

Simulation used for action planning

15

slide-16
SLIDE 16

Simulation used to match supply to demand

load management

Demand Supply + Generator

81%

Supply Demand

56%

load management approaches: … and impacts:

combinatorial search supply scenarios demand scenario goodness

  • f fit

auxiliary duty cycle surplus

  • r deficit

supply v. demand

16

slide-17
SLIDE 17

1. establish initial model for an unconstrained base case design; 2. calibrate model using reliable techniques; 3. assign boundary conditions of appropriate severity; 4. undertake integrated simulations using suitable applications; 5. express multi-domain performance in terms of suitable criteria; 6. identify problem areas as a function of criteria acceptability; 7. analyse results to identify cause of problems; 8. postulate remedies by relating parameters to problem causes; 9. establish revised model to required resolution for each postulate;

  • 10. iterate from step 4 until overall performance is satisfactory;
  • 11. repeat from step 3 to establish design replicability.

Issues: PAMs required for all aspects: comfort, health & productivity; operational & embodied energy, emissions & environmental impact, technology options appraisal, demand management, embedded generation, regulations compliance, hybrid systems control, economics, etc. Requires changes to work practices and adherence to standard performance assessment methods (PAMs – action in blue, knowledge in yellow):

Simulation-assisted design

17

slide-18
SLIDE 18

Model calibration

 A systematic adjustment of model parameters to

  • btain an expected output.

 Input-output pairs for multiple simulation cases are recorded along with corresponding measurements of the outputs and time-matched weather data.  These data are used to construct a ‘meta-model’ that emulates the simulation tool being used.  The meta-model is used to determine the input parameter values that will cause the tool to best reproduce the measured performance.  The best-fit input parameter values are then imposed

  • n the initial model to yield the calibrated model.

18

slide-19
SLIDE 19

Integrated view of performance

Version 1 Version 2 Version 3

19

slide-20
SLIDE 20

The present: a tool-box approach The future: design process integration

Requires adjustments to design practice:  Management of the application process (who does what, when and where).  Implementation of a performance assessment method whereby each step in the process is demarcated and controlled (model definition and quality assurance, calibration, simulation commissioning, results analysis, mapping to design decisions etc.).  Formal method to translate simulation outcomes to design modification.

20

Better tool integration necessary

slide-21
SLIDE 21

Appropriate data presentation

21

slide-22
SLIDE 22

Internal lighting

22

slide-23
SLIDE 23

Visualisation

23

slide-24
SLIDE 24

IAQ & comfort

24

slide-25
SLIDE 25

Air flow and emissions

25

slide-26
SLIDE 26

Integrating renewables: the Lighthouse Building

26

slide-27
SLIDE 27

City action planning

27

slide-28
SLIDE 28

Smart street concept

28

Renewable energy EV charging:

  • PV canopy deployed on car park roofs;
  • scenario simulations undertaken to assess

contribution under progressive charging regimes;

  • results used to inform decision on local battery

sizing. Multi-organisation district heating:

  • university’s new district heating scheme modelled;
  • scenario simulations undertaken to assess system

extension to GCC headquarters building;

  • results used to assess feasibility of shared DH

throughout city. Demand management:

  • Glasgow smart street model constructed;
  • scenario simulations undertaken to assess impact of

alternative demand control regimes;

  • results used to inform deployment of local solutions.
slide-29
SLIDE 29

Car safety

29

slide-30
SLIDE 30

IBPSA Fellows

www.ibpsa.org

Australasia Brazil Canada China Czech Republic England France Germany Japan Netherlands + Flanders Scotland Slovakia Spain Switzerland United Arab Emirates USA Danube Egypt India Argentina Chile Indonesia Ireland Italy Korea Mexico Nordic Poland Turkey

30