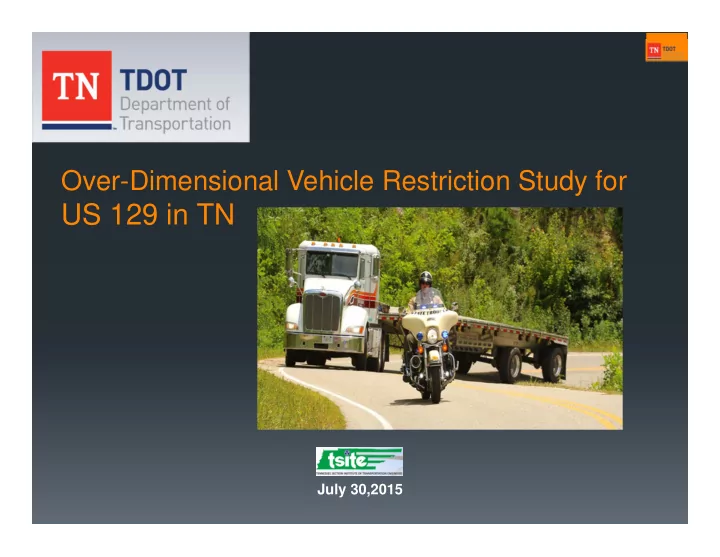
SLIDE 1 Over-Dimensional Vehicle Restriction Study for
US 129 in TN
July 30,2015
SLIDE 2
TDOT Region 1
SLIDE 3
US 129
Location Map
SLIDE 4
US 129
Topography and Scenery
SLIDE 5 Operational and Safety Study
August 2014, US129
Operational and Safety Review
- Regional Alternative Routes
- History of Improvements
- Operational Review of US 129
- Safety Review
- Commercial Vehicle Restrictions
- Summary and Recommendations
SLIDE 6 Operational Study
Alternative Routes - Knoxville, TN to Robbinsville, NC
Route 1:
Drive 1 h 39 min 74 mi
SLIDE 7 Operational Study
Alternative Routes - Knoxville, TN to Robbinsville, NC
Route 2:
- I-40 West to
- I-75 South to
- US 64 East to
- US 74 East to
- US 129 North
Drive 3 h 5 min 178 mi
SLIDE 8 Operational Study
Alternative Routes - Knoxville, TN to Robbinsville, NC
Route 3:
- US 129 South to
- US 411 South to
- SR 68 South to
- US 64/74 East to
- US 129 North
Drive 2 h 55 min 140 mi
SLIDE 9 Operational Study
Alternative Routes - Knoxville, TN to Robbinsville, NC
Route 4:
- I-40 East to
- US 23/74 West to
- US 19/74 West to
- US 129 North
Drive 2 h 48 min 166 mi
SLIDE 10
Operational Study
Alternative Routes, US129
SLIDE 11
Past Studies and Projects
2007 Roadway Safety Audit Review
SLIDE 12
Past Studies and Projects
2007 Roadway Safety Audit Review
SLIDE 13
Past Studies and Projects
SLIDE 14
Past Studies and Projects
SLIDE 15
Operational Study
Traffic Volumes,US129
SLIDE 16 Operational Study
Roadway Geometry
- Mountainous Terrain
- Grades
- 318 Curves in 11-miles
- Curves and Embankments limit SSD
- 9 feet Lane Widths
- Limited Shoulder Width
SLIDE 17
Operational Study
GIS Crash Mapping,US129
SLIDE 18
Operational Study
GIS Crash Mapping,US129
SLIDE 19 Operational Study
Vehicle Simulation
PC: Passenger Car S-BUS-36: School Bus SU-30: Single Unit Truck SU-40: Single Unit Truck WB-40: Intermediate Semi Trailer WB-62: Interstate Semi Trailer
SLIDE 20 Sight Distance
- Length of roadway ahead that is visible to a driver
- 4 Types
- Intersection
- Stopping
- Passing
- Complex Decisions
- Special Consideration
- Grades
- Speeds
- Design Vehicles
SLIDE 21 Stopping Sight Distance
Driving along the Major Roadway
“Stopping sight distance is provided
continuously along each highway or street so that drivers have a view of the roadway ahead that is sufficient to allow drivers to stop, AASHTO pg 650 & 651.”
SLIDE 22 Grades and Effect on Stopping Distance
0% 30 173 221 393 3% 30 185 221 405 6% 30 179 221 399 9% 30 186 221 406 Distance if approaching vehicle is in your lane Grade Speed mph Braking Distance for sum of approaching vehicles Sum of Reaction Distance t=2.5 sec
SLIDE 23
Stopping Distance with Approaching Vehicles
SLIDE 24
Stopping Distance with Approaching Vehicles
SLIDE 25 Operational Study
Restrictions in North Carolina, US129
Current ordinance was effective July 11, 2012.
- They do allow exclusion to one business to operate after sunset with an escort.
Past ordinance 8/29/2008 through 7/12/2012
- Restricted no through trucks with trailers longer than 30 feet
- Prohibited all trucks with trailers longer than 48 feet between the Cheoah Dam
and the Tennessee State Line.
SLIDE 26 Coordination Meetings and Partners
Restrictions in Tennessee, US129
Commissioner and Chief of Staff Community Relations Office HQ Traffic & Permits Strategic Transportation Investments Division Region 1 Director’s Office Region 1 Traffic Region 1 Incident Management Region 1 Sign and Marking
SLIDE 27
News Release
Restrictions in Tennessee, US129
SLIDE 28
Restriction Signs for Tennessee
Contractor Replaces Truck Advisories with Regulatory Signs
SLIDE 29
Restriction Signs for Tennessee
Placed in North Carolina
SLIDE 30
Exception Signs for Brookfield
Smoky Mountain Hydro
SLIDE 31 Project Impacts
Crash Data Evaluation
Fatals Incap Injury Total Pre 2007 RSAR 2006 2008 11.2 8 33 217 Post 2007 RSAR 2009 2011 11.2 5 11 74 2014 Operational Study 2010 2012 11.2 6 34 204 Post Study 2015 Years Mile Post
- Past RSAR and Improvement Projects had a positive impact on Safety and Crash
Reductions
- Truck Traffic was not eliminated with 2007 Warning initiative, 6% of AADT or 60 to 65 a day
using the Mountainous section of US 129
- Rollover Truck Crashes also continued to occur blocking the roadway multiple times in the
Past
- Future Studies to evaluate Truck Restrictions in regard to Operations and Safety of route
SLIDE 32 Thank you
NATHAN VATTER, REGION 1 TRAFFIC ENGINEER
Phone: (865)594‐2456 Nathan.Vatter@tn.gov
Questions & Comments
SLIDE 33 Chapman Highway Sevier County
August 7th 2015
SLIDE 34 TDOT Revenue Sources
$826 Million $976 Million $38 Million
Budget FY 2015
State Federal Local
SLIDE 35 How We Spend Our Money
68% 15% 8% 2% 2% 2% 2% 1%
FY 2013
Construction Projects Maintenance & Preservation Grants Field Operations Equipment & Facility Other State Agencies Administration Other
2% Overhead 83% Construction Projects and Maintenance
SLIDE 36 Tennessee Gas Tax
- Tennessee has a fixed-rate
gas tax
- Federal gas tax – $0.184 per
gallon
- State gas tax - $0.214 per gallon
- Last tax increase was 1989
(25 years ago)
$- $100.00 $200.00 $300.00 $400.00 $500.00 $600.00 1991 2014
$312.00 $543.90
Inflation
SLIDE 37
Fatalities & Injuries in Tennessee
SLIDE 38 GHSO - Chapman Safety Meeting
- Stakeholder Meeting – January 21st 2014
- Attendees –
- Governor’s Highway Safety Office (Organizer)
- Sevier County
- Sevier County Sheriff’s Office
- TN Highway Patrol
- Knoxville Police Department
- TDOT
- Meeting Purpose – Discuss recent fatal and serious injury
crashes and possible counter measures
SLIDE 39
Crash Map (2000-2010)
Henley Bridge to Sevierville
SLIDE 40
Safety Projects Underway
SLIDE 41
Updated Crash Map (2011-2014)
Henley Bridge to Sevierville
SLIDE 42 Fatal Crashes (2011-2014)
Henley Bridge to Sevierville
Vehicle 1 Vehicle 2 Driver 1 Driver 2 1 78 N/A 45 Run‐Off Road Non‐Incap N/A 1 No 2 54 N/A 45 Run‐Off Road Fatal N/A 1 No 3 73 71 45 Angle Unknown Fatal 1 No 4 67 43 45 Angle Non‐Incap Non‐Incap 1 No 5 41 Ped = 45 45 Pedestrian None Fatal Ped Maybe 6 74 82 50 Head‐On Fatal Incap 1 Maybe 7 60 23 50 Angle None Fatal 1 No 8 58 N/A 50 Run‐Off Road Fatal N/A 1 No 9 85 29 45 Head‐On Fatal None 2 No 10 61 38 45 Angle Fatal None 1 No 11 39 17 45 Angle Non‐Incap Fatal 1 No 12 19 N/A 55 Run‐Off Road Fatal N/A 1 Maybe 13 19 51 55 Angle Fatal None 1 Maybe 14 57 55 55 Angle Non‐Incap Fatal 1 Yes 15 26 N/A 55 Run‐Off Road Fatal N/A 1 No 16 21 45 55 Head‐On Incap Fatal 1 Maybe 17 59 N/A 55 Run‐Off Road Fatal N/A 1 Yes 18 22 Ped = 27 55 Pedestrian Unknown Fatal Ped No 19 45 Ped = 53 50 Pedestrian None Fatal Ped No
Chapman Highway 2011‐2014 Fatalities
Passenger (Age 83) Died Comments Pedestrian wore dark clothes/ did not respond to any vehicle horns Alcohol Related V2 fell ill while driving Left‐turning vehicle failed to yield Driver 1 Ran Red Light/ V2 Passenger (Age 56) Fatal High Speed (From Crash Report) V1 (Age19) left‐turning from Canyon Hills struck by NB V2 V1 lost control when braking for stopped vehicle attempting left‐turn (D1 was on opiates and other drugs) Ran‐off the road, Alcohol and drugs were present/ Passenger (Age 2 ) possibly injured Drugs were pesent in V1/ V2 was church bus w/ 12 pass and 1 Fatal Ran off Right side of road and overturned Ped had BAC of 0.33, was either walking or standing in travel lane NB V1 (Age 60) made U‐turn and NB V2 Motorcycle was unable to stop (near Ye Old) Correctable? Speed Limit Driver Age Fatality Number Type of Crash Driver at Fault Injury Alcohol was present V1 failed to yield and turned left in front of Motorcycle V1 attempted to cross Chapman and failed to yield Ped crossing at Meridian St (Old Wal‐Mart) Head On, 4‐L undivided past (Old Wal‐Mart)
SLIDE 43
Chapman Hwy
Typical Section from Seymour and Sevierville
SLIDE 44 Alternative 1 Widen to 5-Lane
Pros
- Provides Efficient Operations
- Improves Future Capacity
- Improves Travel Time
Reliability
Cons
- Cost $40 to 50 million
- Time for Delivery
- Volume do not support concept
in near future
- Competes for funding with
- ther Regional Projects
- Project Impacts
- ROW Acquisition
- Utility Relocations
SLIDE 45 Alternative 2 3-Lane
Pros
- Improves Safety
- Provides Center Turn Lane
- Buffer between opposing traffic
- Safe Refuge for turning traffic
- Reduces Rear-end crashes
- Improves access
- Provides 7 ft. paved shoulders
- Refuge for emergency or disabled vehicles
- Recovery area for errant vehicle
- Safe refuge for mail carrier
- Use for right turning traffic
- Traffic Calming and Reduces speed differentials
- Eliminates Weaving
- Simplifying road scanning and gap selection for
entering vehicles
- Cost $1.5 to 2.5 million, Potential Safety Project
through HSIP funds
Cons
- Increases time spent following
- Limits Future Capacity
Correctable Problems with 3-Lane
SLIDE 46
Route Comparison
SLIDE 47 Alternative 3 Modified 3-Lane with Passing
Pros
- Improves Safety
- Provide safe designated passing areas
- Provides Center Turn Lane
- Buffer between opposing traffic
- Safe Refuge for turning traffic
- Reduces Rear-end crashes
- Improves access
- Provides 7 ft. paved shoulders
- Refuge for emergency or disabled vehicles
- Recovery area for errant vehicle
- Safe refuge for mail carrier
- Use for right turning traffic
- Traffic Calming and Reduces speed differentials
- Eliminates Weaving
- Simplifying road scanning & gap selection for entering vehicles
- Cost $1.5 to 2.5 million, Potential Safety Project, HSIP funds
Cons
- Some time spent following
- Limits Future Capacity
SLIDE 48 Thank you
NATHAN VATTER, REGION 1 TRAFFIC ENGINEER
Questions & Comments