
SLIDE 1
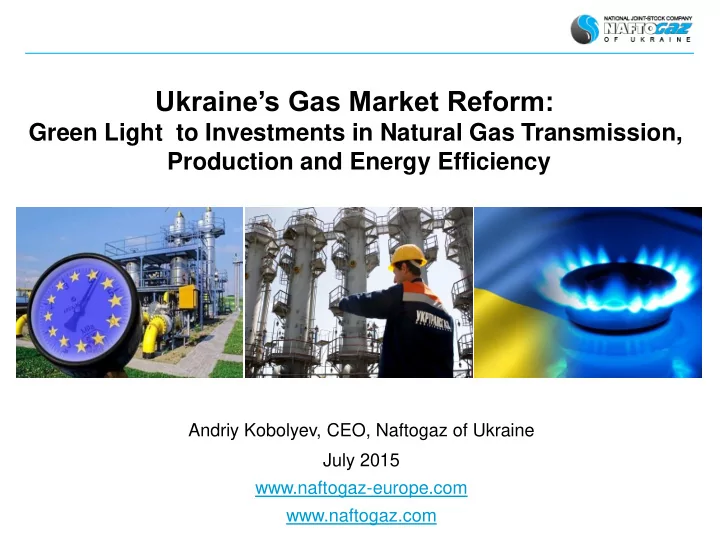
Ukraine’s Gas Market Reform:
Green Light to Investments in Natural Gas Transmission, Production and Energy Efficiency
July 2015 www.naftogaz-europe.com www.naftogaz.com Andriy Kobolyev, CEO, Naftogaz of Ukraine
Ukraines Gas Market Reform: Green Light to Investments in Natural - - PowerPoint PPT Presentation
Ukraines Gas Market Reform: Green Light to Investments in Natural Gas Transmission, Production and Energy Efficiency Andriy Kobolyev, CEO, Naftogaz of Ukraine July 2015 www.naftogaz-europe.com www.naftogaz.com A vertically integrated
Green Light to Investments in Natural Gas Transmission, Production and Energy Efficiency
July 2015 www.naftogaz-europe.com www.naftogaz.com Andriy Kobolyev, CEO, Naftogaz of Ukraine
Gas business ess: : 90% of earnings ings A vertically integrated group: entire supply chain
153 bcm transit capacity 31 bcm of underground
gas storage
62 bcm transit in 2014 38 bcm transmitted
domestically
15 bcm
annual production
39
gas processing plants
230+
condensate fields
till 2012 monopoly
importer
2012 –15 major importer
wholesaler
Naftogaz
iness ess
Upstream, gas processing Gas transportation & storage Wholesale gas trading
major
supplier to households, DHCs
100%
2014-15: Gas market liberalization initiated Gas Market Law: compliant with EU Energy Law
3
Key milestones already reached: EU-UA Gas Network Integration to diversify supply Price Reform: gradual liberalization of gas prices Corporate Governance Reform: OECD standards
Naftogaz effectively diversified gas imports 2013 2014 1Q 2015 Russia, single supplier Europe, multiple suppliers
8% 92% 26% 74% 61% 39%
Sources of Ukraine’s gas imports
4
2015 and on: building competitive and efficient market Production:
5
Competitive and efficient gas market will develop as we: Consumption: improve energy efficiency Transmission :
Storage:
6
Critical funding need for strategic gas purchases Avoiding risk of transit interruptions on political grounds: 21 bcm in storage = no Russian gas required this winter Political risk guarantees: OPIC, WB/MIGA or commercial institutions Repayment source: borrower’s revenues secured by regulated RAB-based tariffs Loans: US$1.8 bn to buy 6.5 bcm of gas from commercial banks, IFIs Collateral:
Naftogaz
Opportunity: transmission and storage partnership
7
Ukraine Cabinet of Ministers State Property Fund
100%
Ownership unbundling of the transmission system operator (TSO) in compliance with 3rd energy package (EU)
EU and/or US companies to be invited as partners in gas transmission and gas storage business
On-going transparency and efficiency improvement through stronger corporate governance in compliance with OECD principles Transmission SO Storage SO
Controlling interest Controlling interest
US/EU Partner US/EU Partner
Non-controlling interest Non-controlling interest
State will remain the owner of the gas transmission system and underground gas storages
99 104 84 86 62 59 54 74 72 96 2010 2011 2012 2013 2014
Transit volumes Excess Capacity
8
Natural gas transit via Ukraine, bcm
Potential benefits for Partner in natural gas transmission operations
Strategic advantages:
Crucial role in the European
transit system, accounting for up to 15 % of total gas import to EU
Sole transmission system operator
158
Most powerful transit infrastructure in the world with capacity of exit - 158 bcm/Y, entry – 288 bcm/Y
Direct interconnections
with EU (PL,SK,HU,RO) and with RU, MD, BY
27 27 27 26 23 25 27 24 20 16 2010 2011 2012 2013 2014
Industry Production and tech. costs Households, District Heating, Government financed institutions
Natural gas domestic supplies, bcm
CAGR: -6%
Supplies to 18 European countries Revenues ensured by regulated
RAB-based tariffs
Substantial potential of transit
volumes increase without significant investment
24 21 20 15 17 7 10 11 16 14 2010 2011 2012 2013 2014
Capacities load (end of injection period) Available storage capacity
9
Potential benefits for Partner in gas storage operations
Strategic advantages:
Storage capacity of over 25 bcm on border with the EU
Largest storage capacity in Europe - 31 bcm (1/3 of EU28)
A valuable complex of assets with potential privatization of some storages
31
Natural gas storage volumes, bcm Huge potential for further development
Strategic geographical location of storages allows gas supply from
border to 6 countries
Essential infrastructure for EU gas stock (both security and commercial) and creation of a gas hub
Energy independence: energy efficiency, production growth
Ukrainian gas import requirement
Energy efficiency Domestic production growth
~20
bcm
3-7
bcm
2015 2020F
How will this be achieved? bcm
bcm
Required investment*: US$10-15 bn Required investment*: US$5-6 bn *Preliminary estimates
10
Opportunity: Energy Efficiency
~15.9
Gas savings, bcm/y Invest- ment, US$bn Where What Alternative fuel boilers More efficient gas boilers Pipes replacement and insulation Thermo modernization Thermo modernization Heat meters with temperature regulators Project scope and time to capture the effect Investment efficiency, cm/US$
0.6 0.8 0.2 0.4
~20 ths boilers
3-5 years
~7mn HH
3-5 years
~250 DHC
3-5 years
~7 mn HH
10 years
~100 ths buildings
10 years
~100 ths buildings
1-2 years
Impact is calculated for each measure separately. Total gas savings in case of implementation of all measures
Alternative fuel boilers More efficient gas boilers
0.3 Total 0.5
~US$36bn ~12 bcm/y
~1.7 3.7 ~2.0 ~2.4 ~10.3 5.5 ~0.8 1.1 ~3.4 ~3.0 ~0.7
11
Energy efficiency measures can save ~6 bcm/y by 2020 and ~12 bcm/y by 2025
Opportunity: Upstream Development
12
Projections
10 20 30 40 50 60 70 1955 1990 2000 2010 2020 Conventional gas production Unconventional gas production Incremental unconventional gas production 2030 2014
Bcm
39Tcf = 1.1Tcm 1
the largest in continental Europe 2
1 Source: US Energy Information Administration 2 Source: BP Statistical Review of World Energy, June 2015.
With sufficient investment production could increase by 7-9 bcm by 2020 and more than double by 2030:
application of modern technologies for seismic evaluation, drilling, completion, well stimulation, and production management. Ambitious plans present opportunities for international gas production companies and companies offering equipment, services and know-how
Source: Energy Strategy of Ukraine till 2030, Ministry of Energy and Coal Industry.
Other urgent investment opportunities
Other urgent investment opportunities
Poland-Ukraine 110 km gas interconnector with capacity of 8 bcm/y will allow to:
▪ Satisfy c. 40% of Ukraine’s
total requirement for natural gas imports
▪ Increase current gas import
capacity from EU by 53%
▪ Contribute to development of
the pan-European “North- South Gas Corridor”
▪ Provide access for EU
traders to UA gas storages with capacity of 31 bcm
14
Complete overhaul of drilling rigs and equipment will allow to:
▪ Expand exploration and
production drilling capacity to 300-350 ths. m/Y by 2020
▪ Increase the average
drilling depth over 6 ths.m
▪ Expand drilling equipment
range to meet current complex drilling tasks
Modernization of Shebelinka Refinery to achieve Euro-5 quality standard will allow to:
▪ Significantly improve
modernization
▪ Potentially increase market
share of the Company up to 15%
▪ Decrease dependency
from imported fuels
▪ Ensure immediate pricing
premium for sales through
▪ Wider use high pressure
equipment and hydraulic fracturing techniques Estimated project cost – 245 mln USD Estimated project cost – 356 mln USD Estimated project cost – 185 mln USD