TV, female empowerment and demographic transition in rural India - - PowerPoint PPT Presentation

tv female empowerment and
SMART_READER_LITE
LIVE PREVIEW

TV, female empowerment and demographic transition in rural India - - PowerPoint PPT Presentation

TV, female empowerment and demographic transition in rural India Presented at LIDC Seminar on Replication, 6/6/2012 Vegard Iversen, University of Manchester & Richard Palmer-Jones, University of East Anglia This work has largely been


slide-1
SLIDE 1

TV, female empowerment and demographic transition in rural India

Presented at LIDC Seminar on Replication, 6/6/2012 Vegard Iversen, University of Manchester & Richard Palmer-Jones, University of East Anglia This work has largely been funded by the International Initiative for Impact Evaluation (3ie)

slide-2
SLIDE 2
  • Jensen, R., & Oster, E. (2009). The Power of TV: Cable

Television and Women’s Status in India *. Quarterly Journal of Economics, 124(3), 1057-1094

– Top ranked economics journal

  • Impact Factor: 5.940

5-Yr impact factor: 8.05

  • Cited by 77 (Google Scholar, Jan, 2012)

– “the introduction of cable television is associated with

  • significant decreases in the reported acceptability of domestic

violence toward women

  • [significant] decreases in son preference, …
  • increases in women’s autonomy and
  • decreases in fertility.
  • increases school enrollment for younger children,
  • perhaps through increased participation of women in household

decision making.”

slide-3
SLIDE 3
  • JO find rapid pro-social improvements in the same year

that cable TV arrives in a village

  • JO suggest, cable TV portrays urban lifestyles

– Women are more empowered

  • New role models
  • Affecting attitudes towards and liberties of women in the home

and workplace

– Cite results of effects of (mainly pro-social) programming in Brazil

  • But - patriarchal attitudes and norms are typically

understood to be rigid and deeply entrenched in village India.

– Longer term trends such as such as juvenile sex-ratio continue to deteriorate

slide-4
SLIDE 4

Continuing female disadvantage e.g. juvenile sex ratios

900 920 940 960 980 1961 1971 1981 1991 2001 2011 Census year population child (0-6)

TV has spread very widely, and become main source of media even in rural India Hence, JO conclusion very surprising

slide-5
SLIDE 5
  • Also – what’s worrying about this figure?
slide-6
SLIDE 6
  • Survey of Aging in Rural India (SARI):

– three year panel data (household and individual), 2001, 2002 and 2003

  • 2700 households with woman over 50; low attrition (108 – 4%)

– five states (Bihar, Haryana, Delhi, Goa and Tamil Nadu)

  • 180 randomly sampled villages
  • Women only interviewed n=3053 (*3 -> 9,159)

– Survey instruments explicitly modelled on female autonomy and attitude modules in NFHS II (1998-99). – Own survey of cable operators in Tamil Nadu

  • District Information System on Education (DISE)

(administrative) monitoring data for

– all villages in 19 randomly chosen Blocks from 5 Districts of Tamil Nadu (with low cable penetration in 1998). – Own survey of date of arrival of cable TV in selected blocks1.

slide-7
SLIDE 7

Analysis

  • SARI

– Tabular and graphic descriptives – Panel analysis (xtreg)

  • Individual responses to village level treatment
  • DISE

– Time series (prais - Prais-Winston estimation)

  • Village level enrolment rates

– Graphic of enrolment (total) by year by year of cable access

is the measure of cable access in village , year ; is outcome for individual in village in year individual fixed effects, are year dummies, and

ivt vt iv t ivt ivt vt ivt iv t ivt

s c c v t s i v t;             X X are other controls

slide-8
SLIDE 8

Replication

  • Replication data & code provided by authors

– SARI

  • final estimation data & analysis code

– DISE

  • Raw data, data preparation & analysis code
  • Checking

– Published results reproduced exactly with data and code tables using SARI and DISE data – DISE data preparation coded contains minor coding error

  • Has significant effect
slide-9
SLIDE 9
  • 5 year olds added to 6-10 aggregate but not 6-

14 aggregate in 2005-7 cohorts

– Has significant effect on Figure 7 (see next slide)

  • DISE analysis of little value

– Mistake reduces estimated effect – Lack of covariates which could account for endogenous CABLE placement

1000 2000 3000 4000 5000 2002 2003 2004 2005 2006 2007

year

got cable 2002 never got cable 4200 4400 4600 4800 5000 5200

enrolment

2002 2003 2004 2005 2006 2007

year

got cable 2003 never got cable 1000 2000 3000 4000 5000

enrolment

2002 2003 2004 2005 2006 2007

year

got cable 2004 never got cable 2000 3000 4000 5000 2002 2003 2004 2005 2006 2007

year

got cable 2005 never got cable 1000 2000 3000 4000 5000

enrolment

2002 2003 2004 2005 2006 2007

year

got cable 2006 never got cable 1000 2000 3000 4000 5000

enrolment

2002 2003 2004 2005 2006 2007

year

got cable 2007 never got cable

Jensen & Oster DISE variables Figure 7: Enrolment of cohort 6-7 year in 2002 by year and access to cable

J&O data Shows rising enrolment in villages with and without access to cable TV!

2000 4000 6000 8000 10000 2002 2003 2004 2005 2006 2007

year

got cable 2002 never got cable 2000 4000 6000 8000 10000

enrolment

2002 2003 2004 2005 2006 2007

year

got cable 2003 never got cable 2000 4000 6000 8000 10000

enrolment

2002 2003 2004 2005 2006 2007

year

got cable 2004 never got cable 2000 4000 6000 8000 10000 2002 2003 2004 2005 2006 2007

year

got cable 2005 never got cable 2000 4000 6000 8000 10000

enrolment

2002 2003 2004 2005 2006 2007

year

got cable 2006 never got cable 2000 4000 6000 8000 10000

enrolment

2002 2003 2004 2005 2006 2007

year

got cable 2007 never got cable

VI & RPJ DISE variables Figure 7: Enrolment of cohort 6-7 year in 2002 by year and access to cable

Authors’ data Shows falling enrolment in villages with and without access to cable TV

slide-10
SLIDE 10

SARI main empirical specification

  • Units – women respondents
  • Treatment variable is Village has cable
  • Controls – INTERACTED WITH YEAR

– Village control - population density, electricity and distance to nearest town – Individual controls

  • Baseline - education
  • Annual - income per capita, age (quadratic),

– Year dummies

  • Identification

– 90 already had cable in 2002 – 21 get cable in 2002 & 3 – 69 never had in this period – All villages in Delhi already had cable TV in 2002 5, 4, 6 & 6 added in Bihar, Goa, Haryana, and TN)

  • Errors clustered at village level
slide-11
SLIDE 11
  • is actually a multi-level model

controls for individual i in village v which are fixed for the base year of the panel period (2001), including years of education and sex, and do not vary over the panel period; controls for individual i of village v in year t, including the log of household income per capita (the household in which the respondent resides) and her age and age

  • squared. Age does not appear

separately, but age-squared does controls for village v set in the year 2001, including the log of population density, the log of distance to nearest large town, and whether the village is electrified (which does not change

  • ver the panel period);

Year * state dummies Cable present in year t Individual fixed effects year t Outcomes for female i in village in year y

slide-12
SLIDE 12

JO’s main results

strongly significant negative coefficients on “village has cable” Low r-square Effects survive when testing for future access to cable Critique Odd outcome variable construction Missing controls including TV watching, ethnicity, migration - others

slide-13
SLIDE 13

Outcome variables (yivy)

  • Index of attitudes to wife beating –

– acceptable if: “wife cheats on him”, “family does enough dowry”, “shows disrespect”, “goes out without permission”, “neglects children”, “cooks badly”

  • Index of women’s empowerment/autonomy:

– women decides:

  • “on expenditure on own health care”, “purchase of major items”,

“visit friends”, “spend her own money” ,

– needs permission to

  • “go to market”, “visit friends”
  • Son preference (next child)
  • Fertility

– Currently pregnant – Pregnant over time

slide-14
SLIDE 14

Outcome variables

  • Outcomes are “Borda” indexes from several

questions

– Some component questions not significantly related to outcomes – Approval index driven by jewellery question

  • Jewellery question driven by TN and lacks external validity

– Autonomy index has duplication of “visit” dimension

  • Respecify outcome indexes to exclude

questionable questions

– Use scaling methods – pca or mca

slide-15
SLIDE 15

Table 3: Coefficient of “Village has Cable” for components of composite outcome variables representing Women’s Status and Autonomy Dependent variable (attitudes to beating) Coefficient on village has cable Dependent variable (autonomy) Coefficient on village has cable (1) (2) (3) (4) (i) He suspects her of being unfaithful 0.013 (0.016) (i) Own healthcare 0.019 (0.023) (ii) Her natal family does not give money or jewellery

  • 0.054***

(0.020) (ii) Purchase of major household items 0.080*** (0.023) (iii) She shows disrespect

  • 0.028

(0.023) (iii) Whether woman will visit or stay with family or friends

  • 0.025

(0.020) (iv) She leaves home without telling him 0.016 (0.014) (iv) Whether woman has money to spend on her own 0.027** (0.013) (v) She neglects the children

  • 0.036*

(0.018) (v) Whether permission is required to go to market 0.064*** (0.013) (vi) She cooks badly

  • 0.071**

(0.031) (vi) Whether permission is required to visit family or friends 0.040*** (0.014) Tolerance measure (mn_outcome – 6 variables)

  • 0.161**

(0.073) Autonomy measure (mn_real – 6 variables) 0.026*** (0.006) Adjusted tolerance measure (5 variables- excludes her natal family does not give money or jewellery)

  • 0.021*

(0.012) Adjusted autonomy measure (5 variables – excludes (vi)) 0.015** (0.007) Tolerance measure (PCA 6 variables)3

  • 0.147**

(0.067) Autonomy measure (PCA – 6 variables) 3 0.131*** (0.038) Tolerance measure (MCA 6 variables) 4 0.091** (0.041) Autonomy measure (MCA – 6 variables) 4

  • 0.119***

(0.028) Tolerance measure (PCA 5 variables3–excludes her natal family does not give money or jewellery)

  • 0.113*

(0.0623) Autonomy measure (PCA – 5 variables) 3- excludes (iii) excludes (vi) 0.180*** (0.0413)) 0.086** (0.0405) Tolerance measure (MCA –5 variables- excludes her natal family does not give money or jewellery) 4 0.0715* (0.0396) Autonomy measure (MCA – 5 variables) 4– excludes (iii)” Excludes (vi)

  • 0.094***

(0.028)

  • 0.026

(0.031) Notes:

  • 1. * p<0.1, ** p<0.05, *** p<0.01
  • 2. estimations replicates J&O Table IV Column (1) and (3) with exception of different dependent variable; estimations include controls as in J&O. These

estimations employed the xtreg command in Stata on dichotomous variables.

  • 3. Outcomes estimates by PCA: positive sign indicates increase in approval for beating
  • 4. Ditto by MCA: a negative sign indicates an increase in approval for beating
slide-16
SLIDE 16

Confounding

  • by education, Christianity, Scheduled Castes, etc.

2 3 4 5

has cable 2001 gets cable 2002 gets cable 2003 never has cable

vhc mean years education 95% ci

years of education by access to cable TV

.02 .04 .06 .08 .1

has cable 2001 gets cable 2002 gets cable 2003 never has cable

vhc mean years education 95% ci

proportion of Christians by access to cable TV

slide-17
SLIDE 17

jm hp pj uc hr dl rj up ap ka ke tn mp gj go as wb jh

  • r

ch sk ar na mn mz tr mg

.2 .4 .6 .8 .2 .4 .6 .8 experience violence from husband north south west east northeast y1

source: authors' calculations from nfhs3 y axis is respondent approves beating for any reason v744a-e x axis is respondent experienced of any form of violence from husband d105a-j

Acceptability and experience of being beaten by husband (rural)

Problems with indexes

  • Wife beating

– Attitudes towards and experience of domestic violence do not correspond very well – JO index is driven by answer to dowry question which may lack external validity

  • Compared with NHFS 1998/9 survey responses

.2 .4 .6 .8 Bihar Delhi Goa Haryana Tamil Nadu

Tolerance of Spousal Beating by Cause, SARI data

cheat money go out neglect bad cook .2 .4 .6 .8 bihar new delhi goa haryana tamil nadu

rural areas, weighted mean

Tolerance of Spousal Beating by Cause (NFHS2)

cheat money go out neglect bad cook .2 .4 .6 .8 [bh] bihar [dl] delhi [go] goa [hr] haryana [tn] tamil nadu

rural areas, weighted mean

Tolerance of Spousal Beating by Cause (NFHS3)

wife is unfaithful argues goes out neglects children burns food

slide-18
SLIDE 18

Results with alternative indexes

  • Beating

– drop dowry question

  • Autonomy

– Reduce duplication

  • Both reduce size and significance of results
  • PCA and MCA indexes

– Coefficients have similar signs and significances, – Size and significance of coefficients decline when suspect questions dropped.

  • Conclusion

– Results are somewhat less convincing

slide-19
SLIDE 19

Discussion of SARI results

  • No theory of change

– By what route does watching Cable TV affect gender attitudes

  • Those who have or watch TV?

– Biggest differences for those who do not have TVs but report watching.

  • Much interesting information lost by using individual fixed effects

– i.e. effects of education, ethnicity, religion, age, occupation, …..

  • Education & proportion of Christians
  • electricity

– Conduct random effects model

  • Inappropriate estimation method

– Endogenous nature of cable placement, TV watching,

  • IV estimation

– multi-level construction of data.

  • Multi-level estimation
  • Lingering suspicion that results are driven by unobserved village

characteristics

– Drop first year

slide-20
SLIDE 20

1 2 3 1 2 3

no TV has TV no TV has TV no TV has TV no TV has TV

2001 2002 2003 2001 2002 2003 2001 2002 2003 2001 2002 2003 2001 2002 2003 2001 2002 2003 2001 2002 2003 2001 2002 2003

does not watch, no cable does not watch, has cable watches TV, no cable watches TV, has cable

Graphs by R watches TV at least once/week and Village has cable TV

Much higher tolerance for beating in villages with cable among those who have no TV, whether they watch TV or or not Decline in tolerance for beating among those who watch TV but do not own

  • ne, whether in villages

with or without cable

slide-21
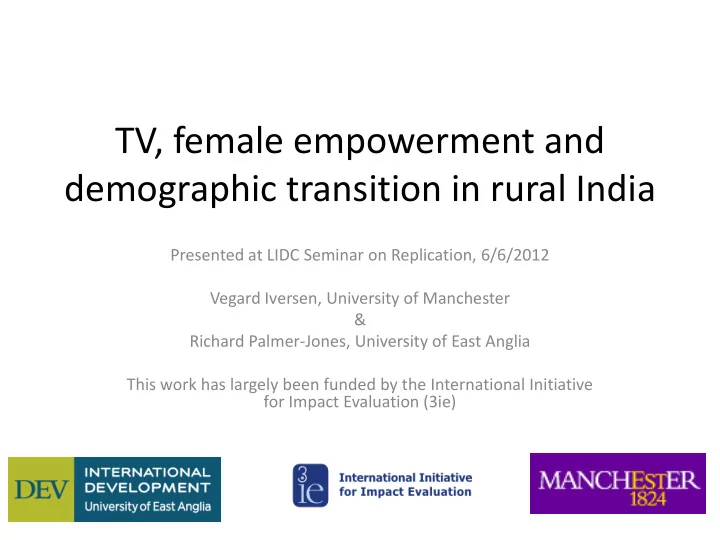
SLIDE 21

No TV Has TV Does not watch TV Watches TV SC/ST Non SC/ST Below 35 35 & above 1 2 3 4 5 6 8 9 Tolerance of spousal beatings

Village has cable Village has cable X Female has no education

Female autonomy

Village has cable Village has cable X Female has no education

Son preference

Village has cable Village has cable X Female has no education

  • 0.27**

(0.130) 0.22* (0.134) N=4391 0.033** (0.015)

  • 0.023

(0.0168)

  • 0.17**

(0.077) 0.13 (0.084) N=1142

  • 0.37***

(0.098) 0.21 (0.167) N=2623 0.071*** (0.016)

  • 0.063***

(0.023)

  • 0.079

(0.1053)

  • 0.018

(0.133) N=557

  • 0.12

(0.165) 0.118 (0.152) N=3589

  • 0.02

(0.05) 0.009 (0.05)

  • 0.027

(0.20) 0.056 (0.051) N=898

  • 0.036***

(0.100) 0.35* (0.182) N=3425 0.064*** (0.015)

  • 0.062***

(0.022)

  • 0.16

(0.106) 0.25 (0.163) N=801

  • 0.32

(0.32) 0.365 (0.324) N=1533 0.039** (0.018)

  • 0.031

(0.028)

  • 0.052

(0.054)

  • 0.05

(0.089) N=338

  • 0.33***

(0.086) 0.23** (0.105) N=5481 0.053*** (0.014)

  • 0.042**

(0.017)

  • 0.158**

(0.073) 0.128 (0.091) N=1361

  • 0.22***

(0.078) 0.23* (0.129) N=4169 0.023* (0.012)

  • 0.022

(0.0178)

  • 0.127*

(0.07) 0.069 (0.08) N=1557

  • 0.38**

(0.19) 0.176 (0.20) N=2845 0.12*** (0.027)

  • 0.096**

* (0.03) Small N

[1] To check these results further we disaggregated into those who watch and do not watch TV: the groups are about equal in size: no significant coefficient for those watching TV while

for women not watching TV, the interaction term of zero education and village has cable is positive, large and significant at the 5 % level.

slide-22
SLIDE 22

Heterogeneity

  • It seems to be women with education who

benefit mainly

– Net effect of cable & cable * woman has no education

  • People who watch TV are affected

– Women in households without TV also benefit, whether they have education or not

  • Scheduled and backward castes less affected

– Sanscritisation?

slide-23
SLIDE 23

Literature review and theory of change

  • Results less strong, more nuanced, and not entirely supportive of

main claims

  • Need for theory (of change)

– How does TV affects attitudes?

  • “media effects” studies

– Effects depend on messages & interpretation (encoder/decoder model) » Importance of actual programmes » Contexts of viewing & discussion of content » Presence of supportive (of pro-social messages) institutions and services – Pro-social programming in India » “Hum log” and “Raathi log”

  • Evaluations do not show obvious pro-social effects

– Other factors affecting attitudes and empowerment

  • Education (content of)
  • Employment
  • Law
  • Civil society action
slide-24
SLIDE 24

Conclusions

  • Initial intuitions of problems with study partially confirmed
  • DISE graph contradicts expectations of falling enrolment

with age

– re-estimated shows results based on programming error

  • SARI findings of strong effects of cable TV contrast with

structural view of women’s disadvantage in South Asia

– Re-working shows results are fairly robust, but

  • important heterogeneity missed (role of being educated),

and

  • methodological queries remain (RE and Mixed effects estimation)
  • Replication suggests need for caution in accepting that

cable TV will liberate women –

– especially in view of continuing/intensifying gender disadvantage – And further research