
SLIDE 1
Turbulence Model Assessment for a Heated Rectangular Riser of Air-cooled RCCS in Turbulent Forced and Mixed Convection Heat Transfer
Sin-Yeob Kim a, Chan-Soo Kim b, Hyoung Kyu Cho a*
aDepartment of Nuclear Eng., Seoul National Univ., 1 Gwanak-ro, Gwanak-gu, Seoul 08826 bNuclear Hydrogen Reactor Technology Division, Korea Atomic Energy Research Institute, 111 Daedeok-daero 989
beon-gil, Yuseong-gu, Daejeon 34057
*Corresponding author: chohk@snu.ac.kr
- 1. Introduction
Reactor Cavity Cooling System (RCCS) is a passive cooling system of Very High Temperature gas-cooled Reactor (VHTR), and it uses natural circulation of
- utside air to remove decay heat emitted from the
reactor vessel [1]. Korea Atomic Energy Research Institute (KAERI) designed air-cooled RCCS incorporating rectangular riser channels [2], whose normal operation condition is in turbulent force convection condition. However, turbulent mixed convection can
- ccur
in emergency
- peration
conditions due to the decrease of the chimney effect and pressure difference inducing lower flow rate of air
- circulation. Therefore, the exact prediction of RCCS
performance is of great importance to ensure the safety
- f the reactor vessel of VHTR. Furthermore,
experimental study and research are insufficient about the heat transfer phenomena inside a rectangular riser. Several researches on the performance of RCCS adopted rectangular riser channels have been conducted with reduced-scale experiment facilities, at KAERI, Argonne National Laboratory (ANL), University of Wisconsin [2, 3, 4]. At Seoul National University (SNU), two experimental studies for the single RCCS riser were conducted; one is for the measurement of local heat transfer coefficient of the single riser and the latter one is for the measurement of local flow structure and turbulence quantities with flow visualization [5, 6]. From the results of these researches, heat transfer deterioration was identified in some experimental conditions whose air flow rate is relatively low, and predictions of the experimental data using CFD analysis showed different calculation results depending on the selection of turbulence models. In this study, using measurement data from the previous flow visualization experiment [6], CFD analysis was conducted in turbulent forced and mixed convection conditions with various turbulence models. By comparing the results of CFD and visualization experiment, including local flow rate and turbulence quantities, the prediction capabilities of turbulence models were assessed. In the end, the relationships between the heat removal through a riser and the flow characteristics were investigated for the further improvement of the prediction of CFD analysis in turbulent forced and mixed convection conditions.
- 2. CFD Analysis for a Heated Rectangular Riser
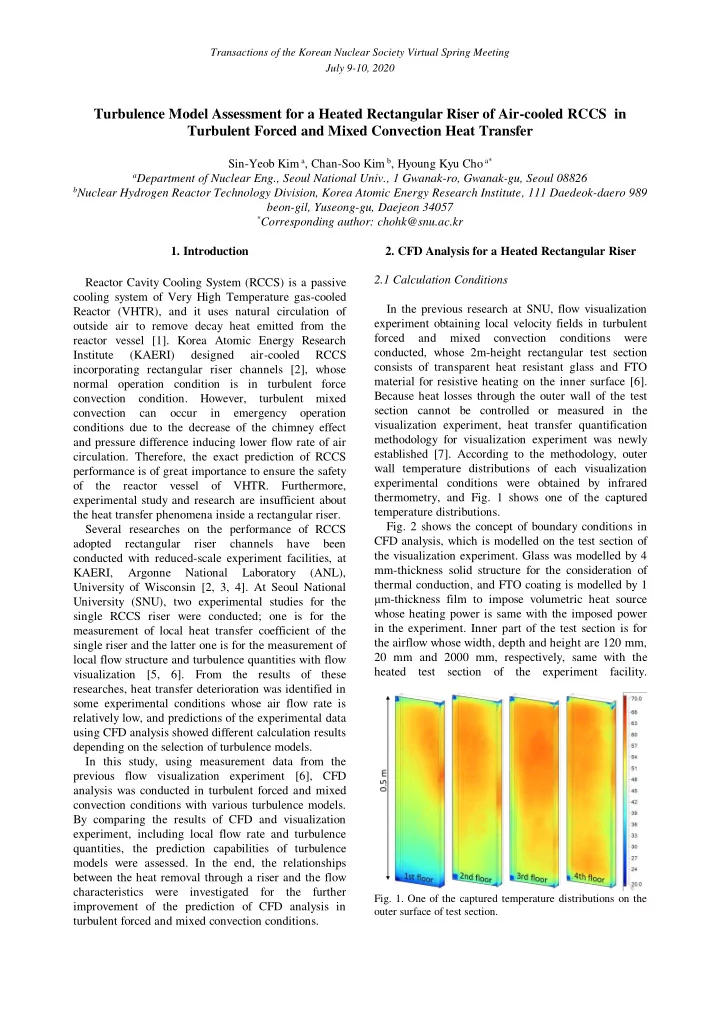
2.1 Calculation Conditions In the previous research at SNU, flow visualization experiment obtaining local velocity fields in turbulent forced and mixed convection conditions were conducted, whose 2m-height rectangular test section consists of transparent heat resistant glass and FTO material for resistive heating on the inner surface [6]. Because heat losses through the outer wall of the test section cannot be controlled or measured in the visualization experiment, heat transfer quantification methodology for visualization experiment was newly established [7]. According to the methodology, outer wall temperature distributions of each visualization experimental conditions were obtained by infrared thermometry, and Fig. 1 shows one of the captured temperature distributions.
- Fig. 2 shows the concept of boundary conditions in
CFD analysis, which is modelled on the test section of the visualization experiment. Glass was modelled by 4 mm-thickness solid structure for the consideration of thermal conduction, and FTO coating is modelled by 1 μm-thickness film to impose volumetric heat source whose heating power is same with the imposed power in the experiment. Inner part of the test section is for the airflow whose width, depth and height are 120 mm, 20 mm and 2000 mm, respectively, same with the heated test section of the experiment facility.
- Fig. 1. One of the captured temperature distributions on the
- uter surface of test section.