
SLIDE 1
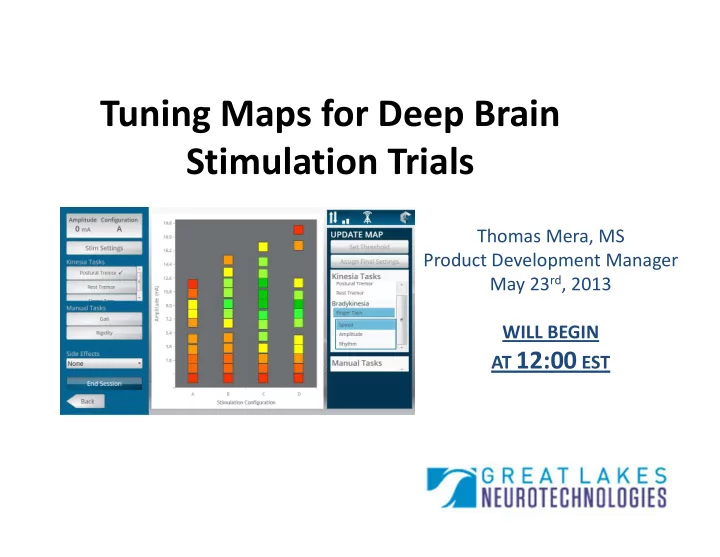
Tuning Maps for Deep Brain Stimulation Trials
Thomas Mera, MS Product Development Manager May 23rd, 2013 WILL BEGIN AT 12:00 EST
Tuning Maps for Deep Brain Stimulation Trials Thomas Mera, MS - - PowerPoint PPT Presentation
Tuning Maps for Deep Brain Stimulation Trials Thomas Mera, MS Product Development Manager May 23 rd , 2013 WILL BEGIN AT 12:00 EST Talking Points 1. Market Opportunities 2. DBS Tuning Maps 3. Kinesia ProView 4. Clinical Trial Data and
Thomas Mera, MS Product Development Manager May 23rd, 2013 WILL BEGIN AT 12:00 EST
SYMPTOMS Tremor Dyskinesias Bradykinesia Rigidity Gait Non-Motor et al. TREATMENTS TREATMENTS Levodopa Levodopa Rasagiline Rasagiline Duodopa Duodopa DBS DBS Exercise Exercise Neuroprotection? Neuroprotection? DEMOGRAPHICS DEMOGRAPHICS Over 60 Over 60 Growing Incidence Growing Incidence Neurodegeneration Neurodegeneration Medicare Medicare VA VA Access to Care Access to Care
Targeted Electrical Stimulation of the Brain
Clinician Training Symptom Tracking Paper Trails Sensitivity
TRADITIONAL HIGH SENSITIVITY
Tremor tuning produces sudden, dramatic effects Bradykinesia tuning produces gradual, fine effects
Kinematic optimization of deep brain stimulation across multiple motor symptoms in Parkinson’s disease Mera TO, Vitek JL, Alberts JL, Giuffrida JP
Peer-Review Publication
Rest Tremor Finger Tapping-Speed
FDA Clearance to Market FDA Clearance to Market
kinematics of movement disorder symptoms such as tremor and assess activity in any instance where quantifiable analysis of motion and muscle activity is desired.
ISO, CE Mark, and TGA ISO, CE Mark, and TGA
Standards and Testing Standards and Testing
U.S. Patent Protection
130 Hz 60 µsec 130 Hz 60 µsec 130 Hz 60 µsec
1 2 3 1 2 3 4 5 6 7 8 9 10 Contact Amplitude (v) 1 2 3 1 2 3 4 5 6 7 8 9 10 Contact Amplitude (v) 1 2 3 1 2 3 4 5 6 7 8 9 10 Contact Amplitude (v) 0.5 1 1.5 2 2.5 3 3.5 4
1 2 3 1 2 3 4 5 6 7 8 9 10 Contact Amplitude (v) 0.5 1 1.5 2 2.5 3 3.5 4 1 2 3 1 2 3 4 5 6 7 8 9 10 Contact Amplitude (v) 0.5 1 1.5 2 2.5 3 3.5 4
1 2 3 1 2 3 4 5 6 7 8 9 10 Contact Amplitude (v) cli sub7 , prog 1 FT
1 2 3 Contact 1 2 3 Contact 0.5 1 1.5 2 2.5 3 3.5 4
1 2 3 1 2 3 4 5 6 7 8 9 10 Contact Amplitude (v) 0.5 1 1.5 2 2.5 3 3.5 4 1 2 3 1 2 3 4 5 6 7 8 9 10 Contact Amplitude (v) 0.5 1 1.5 2 2.5 3 3.5 4
1 2 3 2 4 6 8 10 Contact Amplitude (v) 0.5 1 1.5 2 2.5 3 3.5 4 1 2 3 2 4 6 8 10 Contact Amplitude (v) 0.5 1 1.5 2 2.5 3 3.5 4
1 2 3 1 2 3 4 5 6 Contact Amplitude (v) 1 2 3 1 2 3 4 5 6 Contact 1 2 3 1 2 3 4 5 6 Contact 0.5 1 1.5 2 2.5 3 3.5 4
1 2 3 1 2 3 4 5 6 Contact Amplitude (v) 1 2 3 1 2 3 4 5 6 Contact 1 2 3 1 2 3 4 5 6 Contact 0.5 1 1.5 2 2.5 3 3.5 4
Visual Assessment of Programming Space
Visual Assessment of Programming Space
High Sensitivity Symptom Differentiation
to Unique Stimulation Configurations
High Sensitivity Symptom Differentiation
to Unique Stimulation Configurations
Cloud-Based Data Storage
Cloud-Based Data Storage
Patient Screening
therapies
Patient Screening
therapies
Post Programming Symptom Response
Post Programming Symptom Response
Intelligent and Remote Programming
via telemedicine and broadband communications
Intelligent and Remote Programming
via telemedicine and broadband communications