
SLIDE 1
Helena P. Alves, CGFO, CIA, MBA
Financial Services Director
Gwen E. Ragsdale, MBA
Budget and Procurement Manager
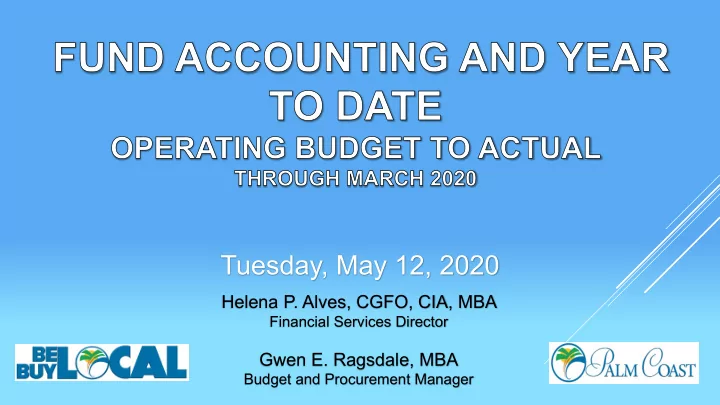
Tuesday, May 12, 2020 Helena P. Alves, CGFO, CIA, MBA Financial - - PowerPoint PPT Presentation
Tuesday, May 12, 2020 Helena P. Alves, CGFO, CIA, MBA Financial Services Director Gwen E. Ragsdale, MBA Budget and Procurement Manager BUDGET PRESENTATION TIMELINE JAN - MAR APR - JUNE Survey Results 3/10 Annual City Council SAP
Helena P. Alves, CGFO, CIA, MBA
Financial Services Director
Gwen E. Ragsdale, MBA
Budget and Procurement Manager
Revenue Restrictions
SAP evaluation 3/18 -3/25
Presentations to City Council
Tentative and Final Millage Rate & Budget
Departments
Ad Valorem Taxes, 12.1% Local Option, Use and Fuel Taxes, 2.8% Communications Services Taxes, 1.1% Local Business Tax, 0.2% Permits, Fees and Special Assessments, 0.7% Intergovernmental Revenue, 9.1% Charges for Services, 46.0% Judgments, Fines & Forfeits, 0.2% Interest and Other Earnings, 0.5% Miscellaneous Revenues, 0.1% Non Revenues, 2.7% Transfers from Other Funds, 5.2% Debt Proceeds, 3.4% Appropriated Fund Balance, 15.9%
Personal Services 20% Operating Expenses 31% Capital Outlay 35% Debt Service 8% Grants & Aid <1% Transfers to Other Funds 5% Contingency 1%
Primarily supported by taxes
Special revenue funds Capital projects funds
Primarily supported by user fees
Enterprise funds Internal services funds
Primarily supported by taxes
Administration & Finance Public Safety (Fire & Police) Community Development (excluding Building) Streets & Parks Maintenance Parks & Recreation
Primarily supported by user fees
Utility Stormwater Building Information Technology Solid Waste Fleet Facilities
$1.3 M $1.1 M $1.1 M $940 K COMMUNICATIONS SERVICE TAX STATE REVENUE SHARING
Other Tax Revenues *
YTD Actual YTD Budget thru MAR $988 K $1.58 M $1.5 M $1 M $1.6 M $1.5 M LOCAL OPTION FUEL TAX SMALL COUNTY SURTAX 1/2 CENT SALES TAX
Tax Revenues Resulting from Shop Local *
YTD Actual YTD Budget thru MAR
* Given the recent Covid 19 epidemic events, a reduction in these revenues is expected. The City Manager has adopted measures to freeze certain operating expenditures until the full effects are measurable.
169 228 272 451 525 100 200 300 400 500 600 ACTUAL FY16 ACTUAL FY17 ACTUAL FY18 ACTUAL FY19 PROJECTED FY20
Pep Tank Installs
601 758 910 950 990 200 500 800 1100 ACTUAL FY16 ACTUAL FY17 ACTUAL FY18 ACTUAL FY19 PROJECTED FY20
Meter Installs
462,967 471,482 481,848 493,855 503,855 FY16 ACTUAL FY17 ACTUAL FY18 ACTUAL FY19 ACTUAL PROJECTED FY 20
Number of Utility Bills
2,618 3,162 4,865 5,334 7,052 7,135 7,895 9,166 10,068 10,718 11,163 12,055 12,946 13,392 2000 4000 6000 8000 10000 12000 14000
2020 Number of Emergency Response Call Trend
2019 Taxable Sales in Palm Coast increased 3% over 2018
$0 $300 $600 $900 $1,200 2012 2013 2014 2015 2016 2017 2018 2019
Millions
Taxable Sales for Flagler County
Palm Coast Flagler County (Excluding Palm Coast)
Through March, Single Family residential permits have increased 22% over 2019
610 696 809
100 200 300 400 500 600 700 800 FY17 FY18 FY19
Single Family Residential Permits
DEPARTMENT BUDGET YTD SPENT % OF BUDGE T SPENT
Administration & Finance: City Manager, City Clerk, City Attorney, HR, Communications, Financial Services, Economic Development $4,711,642 $1,934,958 41% Community Development: Code Enforcement, Planning, Building $ 7,415,908 $ 3,085,391 42% Public Safety: Fire Department and Law Enforcement $ 13,107,073 $ 6,340,842 48% Parks & Recreation: Park Maintenance, Aquatic Center, Tennis, and Golf $ 6,613,103 $ 2,769,364 42% Public Works: Streets, Facilities Maintenance, Fleet $ 17,317,234 $ 7,491,778 43% Construction Management & Engineering Stormwater Utility $ 19,456,420 $ 6,894,717 35% Water & Wastewater Utility $ 23,688,900 $ 10,064,535 42% IT Internal Services $ 3,911,799 $ 1,574,735 41% IT Enterprise Fund $562,506 $186,418 33%
Through March