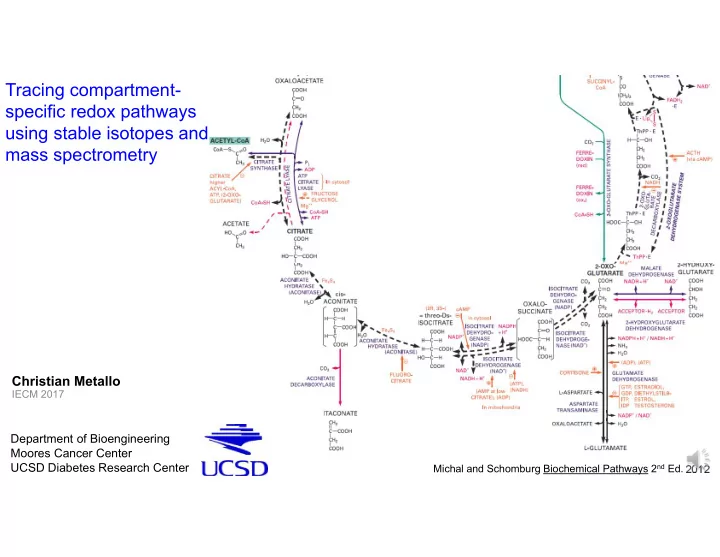
SLIDE 1 Tracing compartment- specific redox pathways using stable isotopes and mass spectrometry
Christian Metallo
IECM 2017
Department of Bioengineering Moores Cancer Center UCSD Diabetes Research Center
Michal and Schomburg Biochemical Pathways 2nd Ed. 2012
SLIDE 2 The challenge for biologists, biochemists, and engineers: Translate biochemistry to metabolic fluxes
5 20 4 36 8 3 8
- Fluxes describe the ultimate function of
metabolic enzymes Use isotopic tracers
- This is where metabolomics/analytical chemistry
meets cell biology
- Metabolite level measurements only get you so far
Analyze data as a system MODELING!!!
A + B C D
X Y
SLIDE 3 5 20 4 36 mol/(cell·hr) 8 3 8
13C and 2H
metabolic tracing Mass spectrometry Systems-based flux analysis Identify drug targets and pathway mechanisms Cultured mammalian cells (cancer, iPSCs, adipocytes) Animal models Humans
1. Targeting metabolism in cancer (Grassian et al. Canc Res 2014; Svensson et al. Nat Med 2016; Parker et al. Met Eng 2017) 2. Cellular compartmentalization and redox metabolism (Lewis et al. Mol Cell 2014; Vacanti et al. Mol Cell 2014) 3. Metabolic changes during iPSC growth/differentiation (Badur et al. Biotech J. 2015; Zhang et al. Cell Rep 2016) 4. Regulation of macrophage metabolism (Cordes et al. JBC 2016) 5. Understanding adipose tissue metabolism and physiology in the context of T2DM (Green et al. Nat Chem Bio 2016)
Studying metabolism for flux sake
SLIDE 4 Glucose De novo lipogenesis
Cit aKG SucCoA Fum Mal Oac Pyr CO2 CO2 CO2 AcCoA CO2 CO2 Pyr mitochondria cytoplasm Cit AcCoA Oac Palmitate
0% 10% 20% 30% 40% 50% 60% M0 M1 M2 M3 M4 M5 M6
% labeling from Gluc
MS
0% 5% 10% 15% 20% 25% 30% 35% % labeling from Gluc
# of isotopes per molecule
Allows quantitation of:
- 1. Contribution of different substrates to AcCoA
pools and mitochondrial metabolism
- 2. Fatty acid synthesis/de novo lipogenesis rates
- 3. Directionality of TCA metabolism
- 4. Intracellular fluxes with MFA modeling
= Carbon atom = 13C atom
Our approach to study cell physiology and metabolism
SLIDE 5 Pyr Cit aKG Suc Mal Oac AcCoA Fum aKG CO2 Glu Glutamine CO2 CO2 CO2 NADP+ NADPH AcCoA Oac Cit 0% 20% 40% 60% 80% 100% Normoxia Hypoxia % contribution to lipogenic AcCoA
Glutamine reduction Glucose oxidation
Metallo et al. Nature (2012), Mullen et al. Nature (2012), Scott et al. JBC (2011), Wise et al. PNAS (2011)
Reprogramming of TCA metabolism under hypoxia
Hypoxic and pseudohypoxic cells exhibit increased reductive carboxylation flux
- Compartmentalization of metabolic processes is critical for cell function (but complicates analysis)
- Redox metabolism is perturbed by hypoxic stresses
Pyr Gluc Lac
PDK1 HIF/ARNT PDH Hypoxia VHL loss
SLIDE 6 Pyr Cit aKG Suc Mal Oac AcCoA AcCoA Oac Fum Cit aKG CO2 Glu Glutamine CO2 CO2 CO2 Pyr NADP+ NADPH
Redox metabolism is highly compartmentalized
PEP 3PG T3P H6P Glucose Ser Gly R5P 6PGD
NAD+ NADH NADP+ NADPH
Lac
NAD+ NADH NADP+ NADPH
Pyridine nucleotides [NAD(P)H] orthogonally connect metabolic pathways via electron transfer NADPH: redox homeostasis/reductive biosynthesis NADH: cellular bioenergetics Neither is transported in/out of the matrix
SLIDE 7 13C tracing and metabolomics cannot resolve compartment-specific metabolism
Pyr Cit aKG Suc Mal Oac AcCoA AcCoA Oac Fum Cit aKG CO2 Glu Glutamine CO2 CO2 CO2 Pyr NADP+ NADPH Glucose
H H
Eukaryotes are highly compartmentalized
How are NADPH and NADH regenerated in the cytosol and mitochondria?
SLIDE 8
Tracing the oxidative PPP with [2H]glucose
w/ Matt Vander Heiden (MIT) Lewis et al. Molecular Cell 2014
SLIDE 9
Tracing the oxidative PPP with [2H]glucose
SLIDE 10
Contribution of the oxidative PPP to NADPH pools
SLIDE 11 0% 5% 10% 15% 20% 25% 24 48 72 Label from [4-2H]glucose Hours Lactate Malate G3P
NADH shuttles and mitochondrial metabolism regenerate NAD+ for glycolysis
2H label enters TCA cycle via malate- aspartate shuttle
SLIDE 12 Do kinetic isotope effects affect results?
- Deuterium lowers rates in enzyme reactions (in vitro)
- Is this relevant to tracing through metabolic networks?
- Allow “H” and “D” to compete by diluting
- Compare labeling
Cytosolic NADPH pathways NADH metabolism
SLIDE 13
(L)2HG and (D)2HG have different origins and are labeled distinctly via 2H tracers
MDH and LDH generate (L)2HG from NADH Oncogenic IDH1 generates 2HG from cytosolic NADPH 2HG is distinctly labeled by these tracers (L)2HG (D)2HG
SLIDE 14 mIDH2 mIDH1
2HG 2HG
Can we probe NADPH metabolism in mitochondria?
IDH mutations identified in low-grade gliomas, AML, and other tumors (Parsons et al. Science 2008 and others) Gain-of-function mutations in IDH1 and IDH2 Mutant enzymes reductively generate (D)2HG using aKG and NADPH (Dang et al. Nature 2009)
Pyr Cit aKG Suc Mal Oac AcCoA AcCoA Oac Fum Cit aKG PEP CO2 Glu 3PG Glutamine T3P H6P Glucose Ser Gly R5P CO2
Lipids
mitochondria cytosol
CO2 CO2 Pyr 6PGD
NAD+ NADH NADP+ NADPH
Lac
NAD+ NADH NADP+ NADPH
SLIDE 15
Using 2-HG production as a reporter of compartment-specific NADPH pools
Minimal effect on central carbon metabolism Grassian et al. Cancer Research (2014)
SLIDE 16
Cytosolic NADPH trace (via oxidative PPP)
2H detection on 2HG provides readout of cytosolic vs. mitochondrial NADPH metabolism
Using 2-HG production as a reporter of compartment-specific NADPH pools
NADH trace (via glycolysis)
SLIDE 17
Tibbetts and Appling, Ann. Rev. Nutr. 2010
Can we use this reporter to annotate compartment-specific metabolic pathways? Folate-mediated one carbon metabolism
SLIDE 18 (L) ( ) ( )
Can we use this reporter to annotate compartment-specific metabolic pathways? Folate-mediated one carbon metabolism
SLIDE 19 Discerning compartment-specific serine metabolism using cofactor tracing
mtIDH1‐C mtIDH2‐M % labeled 2HG
NADPH produced from serine only observed in mitochondria
(L) ( ) ( )
SLIDE 20 Discerning compartment-specific serine metabolism using cofactor tracing and mIDH reporters
Serine, glycine, and folate-mediated one carbon metabolism generate mitochondrial reducing equivalents
(L) ( ) ( )
SLIDE 21 Cytosolic reactions consume NADPH/produce serine NADPH from the oxidative PPP appears on serine
Discerning compartment-specific serine metabolism using cofactor tracing
NAD+
2H-NADH
NNT
SLIDE 22 Resolving compartment-specific NADPH metabolism using 2H tracers and mutant IDH
- 2H tracers allow for quantitation of NAD(P)H
metabolism
- Oncogenic IDH1 and IDH2 used as reporters for
compartment-specific NADPH labeling Lewis et al. Mol Cell 2014
0% 5% 10% 15% 20% 25% 24 48 72 Label from [4-2H]glucose Hours Lactate Malate G3P
SLIDE 23
How is NAD(P)H metabolism reprogrammed under hypoxia?
Oxidation of GAPDH under hypoxia leads to increased loss of isotope Increased exchange flux at TPI/aldolase
Hypoxia
SLIDE 24 Hypoxia increases flux through the oxidative pentose phosphate pathway
GAPDH oxidation leads to increased (15-40%)
- xidative PPP contribution to NADPH pools
Hypoxia
SLIDE 25 Hypoxic induction of reductive carboxylation is mediated by cytosolic oxPPP flux and IDH1
Pyr Cit aKG Suc Mal Oac AcCoA Fum aKG CO2 Glu Glutamine CO2 CO2 CO2 NADP+ NADPH AcCoA Oac Cit
Pyr Gluc Lac
PDK1 HIF/ARNT PDH Hypoxia
SLIDE 26 Acknowledgements
Metallo Lab
Martina Wallace Thekla Cordes Le You Mehmet Badur Courtney Green Avi Kumar Austin Lefebvre Noah Myers Hui Zhang Seth Parker Nate Vacanti
Salk Institute
Reuben Shaw
MIT
Matt Vander Heiden
UCSD
Pedro Cabrales Rohit Loomba Anne Murphy Ajit Divakaruni
Support
NSF CAREER Award DOD Lung Cancer Research Program NIH/NCI Searle Scholars Program California Institute of Regenerative Medicine Hellman Faculty Fellowship Lowy Medical Research Foundation Camille and Henry Dreyfus Teacher-Scholar Award
SBMRI
Jorge Moscat Maria Diaz-Meco
UCSD/VAMC SD
Ted Ciaraldi Bob Henry
UMass Worcester
Dave Guertin
UC Berkeley
Dan Nomura
UPenn
Katy Wellen