
SLIDE 1
- P. Ciavola-UNIFE-cvp@unife.it
Towards the improvement of the Emilia-Romagna coastal EWS: bridging scientific knowledge with stakeholder’s needs and perspectives
Clara Armaroli1,2, Paolo Ciavola1,2 and Luisa Perini3
1,2Università di Ferrara-Consorzio Futuro in Ricerca, Ferrara, Italy 3Geological, Seismic and Soil Service, Emilia-Romagna Region, Bologna, Italy
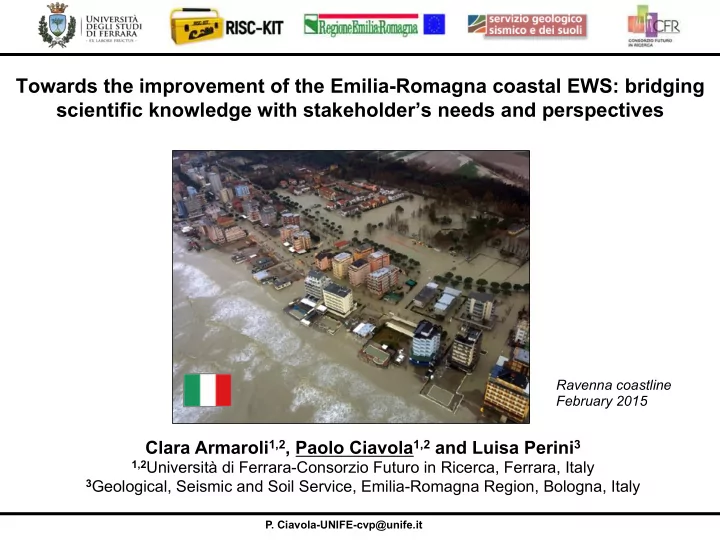
Ravenna coastline February 2015