
SLIDE 1
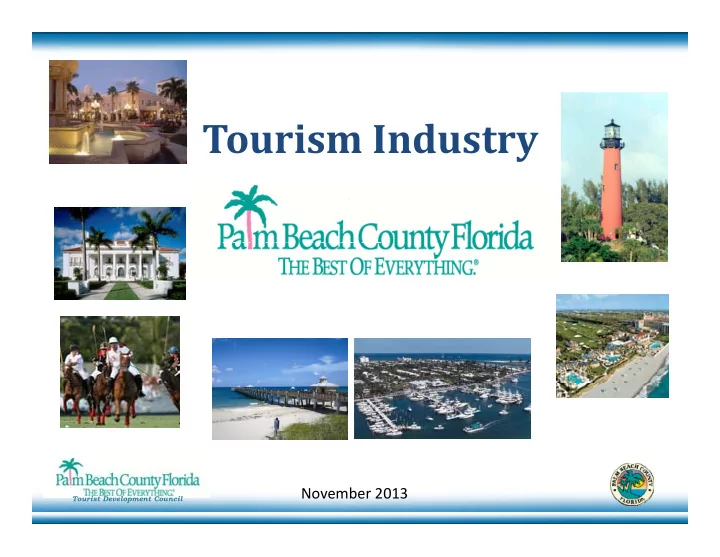
Tourism Industry
December 2011Bed December 2011Bed
Tourist Development Council
November 2013
Tourism Industry December 2011Bed December 2011Bed November 2013 - - PowerPoint PPT Presentation
Tourism Industry December 2011Bed December 2011Bed November 2013 Tourist Development Council Department of Environmental Resources Management Tourist Development Council 2 Palm Beach County Tourist Development Council Table of Organization
December 2011Bed December 2011Bed
Tourist Development Council
November 2013
Department of Environmental Resources Management
Tourist Development Council
2
Palm Beach County Tourist Development Council Table of Organization Table of Organization
Palm Beach County Board of County Commissioners y
Palm Beach County Administration
Global Spectrum Ovations
Tourist Development Council and Administration*
Beach Programs (ERM)
Administration Convention & Visitors Bureau** Cultural Council** Film & Television Commission** Sports Commission** Bureau
** Agencies contracted with Palm Beach County, with oversight by TDC Administration
Tourist Development Council O:TDC.ConventionCenter 2007.Final TO
TDC Administration * TDC Administrates 4th Cent Fund, Special Projects, Beach Program
Tourist Development Council
4
P id l d hi i k ti d d l t f
local amenities for future economic benefit
governing Tourism
Tourist Development Council
5
Tourist Development Council
6
Tourist Development Council
7
Tourist Development Council
8
#1 in Occupancy Growth at 6.3% across the State of Florida
Tourist Development Council
9
Source: STR
1982-1983 1 Cent 70% Marketing/30% the Arts 1984-1988 2 Cents 70% Marketing/30% the Arts 1984 1988 2 Cents 70% Marketing/30% the Arts 1989-1994 3 Cents 55% Marketing, 25% Arts 17% Beaches, 3% Sports 1994-2006 4 Cents 40% Marketing, 17% Arts 11% Beaches, 4% Sports, 3% Film 25% Debt Service Stadium/Conv., Convention Ctr. Operating & RR 2007- Today 5 Cents 31% Marketing, 14% Arts, 8% Beaches 4% Sports 3% Film 8% Beaches, 4% Sports, 3% Film 20% Stadium/Convention Debt Service, 20% Convention Center Expansion, Operating & RR
Tourist Development Council
10
g Stadium and the Convention
losses at the Convention Center and designated for construction, expansion, enlargement, remodeling, repair and/or i t f th C ti improvement of the Convention Center and capital maintenance of Roger Dean Stadium.
Roger Dean Stadium and the Palm
Tourist Development Council
11
Roger Dean Stadium and the Palm Beach County Convention Center.
The remaining 3%, or 3 cents on each dollar collected is then used for Marketing ,Promotion, Grants and Marketing ,Promotion, Grants and Beach re-nourishment efforts.
(Per Local Ordinance)
d d th
Funds distributed first to: Special Tourism Projects $150K
Remaining dollars allocated to:
Convention and Visitors Bureau
Tourist Development Council
12
Resources Management
Tourist Development Council
Volume of PBC visitors has recovered to 2007 levels.
PBC Visitation 2007‐2012 PBC International Visitation ‐ 2012 7.5%
*International estimate from Department of Commerce
Tourist Development Council
14
New York visitation has significantly grown over the last year, Top DMAs
Top States
g y g y , while trips from South Florida have declined.
PBC Top Domestic Feeder Markets
(Percent of Domestic Visitation) 15 8 16 9 9 10 21
Port St Lucie Ft Pierce Miami-Ft. Lauderdale Orlando-Daytona Beach-… New York
2 12 42 4 6 19 38
Califo nia Georgia New York Florida
p
2 4 7 7 4 4 5 9
Atlanta Boston Tampa-St. Petersburg … Port St. Lucie-Ft Pierce
4 5 4 1 3 4 4 4
Maryland New Jersey Massachusetts California
2 2 3 1 2 3 3 3
Baltimore
Washington, DC … Los Angeles
2 2 3 4 2 2 3 3
C ti t Virginia Ohio Pennsylvania
2 1 1 2 2 2 2
Charlotte Hartford & New Haven Jacksonville Baltimore
2 2 1 2 2 2
North Carolina Michigan Connecticut
Tourist Development Council
15
2012 2011
Information provided Discover Research & TNS Visitor Profile
Whil i it ti h i d l th f t h d d b t t f i ht Still
While visitation has increased length of stay has decreased about a quarter of a night. Still the average stay is much longer than the US. 3.5 3.25 3.4 1.75 2011 2012 FL Avg US Avg
Tourist Development Council
16
Information provided Discover Research & TNS Visitor Profile
Most visitors to PBC travel to visit friends and relative Other reasons for travel like SMERF
l h
Primary Purpose of Visit
Most visitors to PBC travel to visit friends and relative. Other reasons for travel like SMERF have become increasingly important to PBC.
11 10 53 26
Trips to Palm Beach County T i t SE Fl id
16 10 8 7 46 38 31 46
Trips to SE Florida Trips to Florida
12 5 54 29
ps to
Trips to PBC, Prior Report
Business Personal Business/ Other VFR Leisure
Tourist Development Council
17
Information provided Discover Research & TNS Visitor Profile
Source: Palm Beach County Economic Impact Study May 2012
Tourist Development Council
y p y y
18
Activities Participated/Attractions Visited by PBC Visitors
50% 49% 43% 19% 19% 16% 12% 6% 6% 12% 6%
Family A ti iti / Enter- t i Nature/ O td Art/ C lt Sight- i Sports/ R Parks/ G d Adventure S t Activities/ Reunion tain- ment/ Amuse- ment Outdoor Activities Culture seeing Recrea- tion Gardens Sports
Tourist Development Council
19
Information provided Discover Research & TNS Visitor Profile
PBC f b t i f il t
32%
35%
Lifestage Segment of Visitors to Florida and PBC
PBC performs best in non‐family segments (Young & Free, Maturing & Free, Affluent Mature).
18% 17% 20% 19% 18% 32%
20% 25% 30% 35%
Florida PBC 13% 12% 9% 8% 4% 7% 8% 10%
5% 10% 15% 0%
Young & Free Young Family Maturing & Free Moderate Family Affluent Family Moderate Mature Affluent Mature
Young & Free ‐ 18‐34; any income; no kids Young Family 18 34; any income; kids in HH Young Family ‐ 18‐34; any income; kids in HH Maturing & Free ‐ 35‐54; any income; no kids Moderate Family ‐ 35‐54; <$75K; kids in HH Affluent Family ‐ 35‐54; $75K+; kids in HH Moderate Mature ‐ 55 or older, <$60K; no kids Affluent Mature ‐ 55 or older; $60K+ no kids
Tourist Development Council
20
Affluent Mature 55 or older; $60K+, no kids Information provided Discover Research & TNS Visitor Profile
Tourist Development Council
21
Tourist Development Council
22
Tourist Development Council
23