
SLIDE 1
ROBERT J. WILSON
FOR THE T2K COLLABORATION
15 DECEMBER 2010 NNN2010 – TOYAMA, JAPAN
ν ν ν ν ν ν ν ν
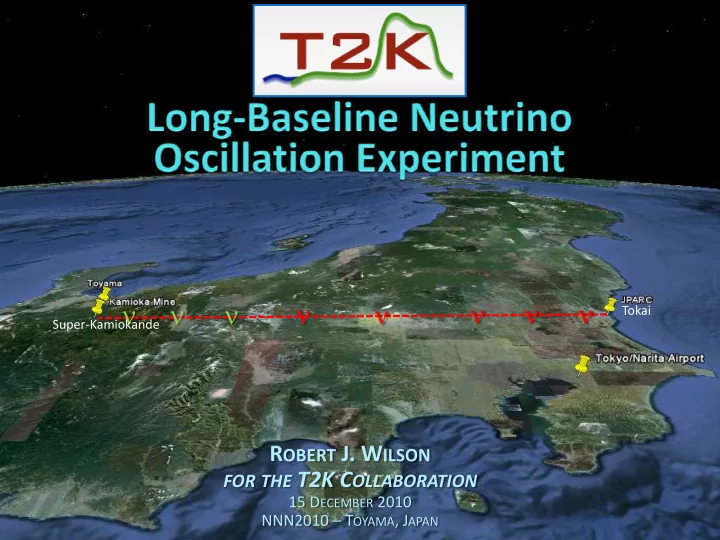
Tokai Super‐Kamiokande
Tokai Super Kamiokande R OBERT J. W ILSON FOR THE - - PowerPoint PPT Presentation
Tokai Super Kamiokande R OBERT J. W ILSON FOR THE T2K C OLLABORATION 15 D ECEMBER 2010 NNN2010 T OYAMA , J APAN T2K Goals Measure last unknown mixing angle 13 using e appearance
ROBERT J. WILSON
FOR THE T2K COLLABORATION
15 DECEMBER 2010 NNN2010 – TOYAMA, JAPAN
Tokai Super‐Kamiokande
4 R.J.Wilson/Colorado State University
Measure last unknown mixing angle θ13 using νμ ➞ νe
appearance
Precise measurement of the atmospheric parameters θ23 and
Δm322 using νμ ➞ νμ disappearance
0.00 0.02 0.04 0.06 0.08 0.10 0.12 0.14 0.16 0.0 0.5 1.0 1.5 2.0 2.5 3.0 3.5 4.0 4.5 5.0 E(GeV)
5 R.J.Wilson/Colorado State University
Approximation to 3‐flavor vacuum mixing with Δm21
2 << Δm32 2
Effectively 2‐flavor mixing Amplitude proportional to sin22θ13 No evident CP phase δ dependence L/E chosen for oscillation maxima
T2K L = 295 km ⇒ Eν
Pmax ≈ 0.6 GeV
sin2θ23=0.5 sin22θ13=0.15
0.08 0.07 0.06 0.05 0.04 0.03 0.02 0.01 0.00
Charged‐Current Quasi‐Elastic (CCQE) dominant near 1st oscillation max Good efficiency and energy resolution in Super‐K Major Backgrounds at Super‐K νμ disappearance: CC π+ is comparable size to CCQE in νμ measurement νe appearance: NC π0, since γ and e indistinguishable in Super‐K These factors guided the beam and near detector design
6 R.J.Wilson/Colorado State University
On‐axis beam spectrum peaks ~2 GeV Want to maximize neutrino flux at the appearance probability peak Narrow spectrum to reduce backgrounds from higher energy processes
ν flux – 30 GeV p MR ON‐AXIS
7 R.J.Wilson/Colorado State University
π μ
θ
νμ
) cos ( 2
2 2
θ
π π μ π ν
p E m m E − − =
Correlation between neutrino energy and direction with pion energy
ν flux – 30 GeV p MR
Optimum for 1st max flux and background reduction at ~2.5° off‐axis
8 R.J.Wilson/Colorado State University
ON‐AXIS
0 m 280 m 295 km
π p
2.5º
Target Near Detector Far Detector (SK)
ν
120 m
Muon monitor Decay pipe &Horns On-axis detector Off-axis detector
μ
J-PARC
ND280
(INGRID)
Beam monitoring Primary beam monitors (intensity, position, profile) Muon monitor after the decay pipe On‐axis detector (INGRID) at 280 m from the target Beam characterization and cross section measurements Near Detector at 280 m (ND280) 2.5° off‐axis from the beam Far detector neutrino flavor and flux measurement Super‐K 2.5° off‐axis from the beam
9 R.J.Wilson/Colorado State University
10 R.J.Wilson/Colorado State University
MC
Almost pure νμ beam νe contamination ~1%
~0.5% νe contamination at the peak
11 R.J.Wilson/Colorado State University
12 R.J.Wilson/Colorado State University
3‐flavor mixing in vacuum (matter effect is small for T2K baseline)
Effect of CP on the phase term is δ→−δ hence the nomenclature δCP Oscillation measurement, and measurement of sin22θ13, depends on δCP If any angle is zero oscillation measurement is not sensitive to δCP
⇒ measurement of θ13 is critical for future CPV experiments
sin2 θ12 = 0.8704 Δm2
12 = 7.6 x 10‐5 eV2
sin2 θ23 = 1.0
Exposure: 750 kW X 5 X 107s X 22.5 kt fid. mass
sin2θ13 sensitivity depends on unknown δCP ; usually given for δCP =0
MINOS – Nu2010
13
Δm2
23 = 2.4 x 10‐3 eV2
Expected backgrounds at Super‐K
Intrinsic νe in beam, ~60% False e‐ candidates, e.g. from NC π0, ~40%
⇒ important to understand systematics on these backgrounds
Analysis goal is to keep fractional uncertainty on each
background source to < 10%
14 R.J.Wilson/Colorado State University
Sensitivity goal : 0.006 (0.008) for normal (inverted) hierarchy
(~1/20 CHOOZ limit)
δCP= 0, Δm223 = 2.5 x 10‐3 eV2 Effect of systematics
Design Goal: 3.75 MW × 107s
15
Nν
sin22θ = 1.0 Δm2 = 2.7 x 10⁻³ eV2
sin22θ23 Δm32
2 16
Measured by Super-K
ν ν ν ν μ
θ ν ν E L m E N N P
x
4 / sin 2 sin ) ( / ) (
2 32 2 23 2 null
Δ ≈ = →
R x Φν
ND
x σν
water
Far/Near
Extrapolated from MC verified by NA61
Near detector flux Measured by near detectors
Estimated Systematics uncertainties
Normalization – 10% Non‐QE/QE ratio – 20% Energy scale – 4% Spectrum width – 10%
δ(sin22θ23) δ(Δm2 23) 17 R.J.Wilson/Colorado State University
90% c .l. T 2K w/ 3.75 MW×10 7 s
MI NOS & Supe r-K pre limina ry @ Nu10
18 R.J.Wilson/Colorado State University
Narrow beam spectrum
centered on oscillation maximum ⇒ good sensitivity to atmospheric parameters
Expected sensitivity Δsin22θ23≈0.01 Δm2
23 < 1.0 x 10‐4 eV2
MINOS
19 R.J.Wilson/Colorado State University
20 R.J.Wilson/Colorado State University
Nakadaira‐san talk for more details
20
3 GeV RCS 30 GeV Proton Synchrotron 181 MeV Linac Neutrino Beamline ND280
(6 bunch Jan‐June 2010)
~
First T2K run (January to June 2010) ~50 kW stable operation; 3.23 ×10¹⁹ protons for analysis Second run started Nov. 16 – rapid ramp up to current 115 kW
21
Summer Shutdown 6→8 bunches
22 R.J.Wilson/Colorado State University
Barrel ECAL installation finished Oct 2010 Completes ND280! On‐Axis Monitor (INGRID) Off‐Axis Detector Near Detector at 280 m ND280
Side Muon Range Detector
First e ve nt
Beam Profile X Beam Profile Center X
23 R.J.Wilson/Colorado State University
Monitor beam direction, intensity and
mean energy
Off‐axis angle measurement accuracy goal 1
mrad (< 15 MeV on off‐axis peak energy)
Beam position resolution ~ 7 cm ⇒ ~3 mm
shift at proton target
~ 10k ν interactions per day at full power
Six bunch beam structure
24 R.J.Wilson/Colorado State University
Event Rates (P0D+FGD)/1021 PoT : 600k μ‐ only 300k μ‐p 40k μ‐π0 8k e‐ only 5k e‐p 0.8k e‐π0
Contained vertices reconstructed in P0D and FGD Lines show (approximate) iso‐contours of off‐axis angle Outer corner is roughly 20% further off‐axis than inner corner
P0D
25 R.J.Wilson/Colorado State University
More details in Roger Wendell’s Talk 50 kt (22.5 kt fid.) Water Cherenkov detector: 11,129 20” PMTS in inner
detector (ID) and 1885 8” PMTS in outer detector (OD)
T2K
Dead‐timeless read out electronics and DAQ upgrade in 2008 GPS system used to select time arrival of beam events
26 R.J.Wilson/Colorado State University
Timing coincident w/ beam time (+TOF) Fully contained (No OD activity) Vertex in fiducial volume (vertex > 2 m from wall) Evis > 100 MeV no of rings =1 e‐like ring No decay electron
< 105 MeV Eν
rec < 1250 MeV
Evis > 30 MeV no of rings =1 μ‐like ring νμ disappearance analysis νe appearance search
SK event selection decided before the run Possible because SK is a mature & well understood detector
27
28
pμ = 1061 MeV/c 1 decay‐electron pμ = 1438 MeV/c 2 decay‐electrons
Jan‐June 2010 # of events Fully‐Contained (FC)
33
+ fiducial volume cut + visible E > 30 MeV (FCFV)
23
∆T0 = SK trig time -T2K beam trigger time
GPS works well ‐ very good time synchronization
between T2K beam and Super‐K
Change 6‐>8 bunches since Nov. evident
29
Jan‐June Nov.‐Dec.
30 R.J.Wilson/Colorado State University
Started Nov. 18th ~50% increase in data in 3 weeks Current beam power ~115 kW Aim for 150 kW × 107s by July 2011 10x 1st run data sensitivity to sin22θ13 ≈ 0.05
Design Goal: 3.75 MW × 107s July 2011 goal
1st run January–June 2010
Continuous beam at ~50 kW, accumulated 3.23 x 10¹⁹ PoT Good overall stability of beam and detector performance Measured 23 neutrino beam events (FCFV) at Super‐K Expect first results by winter 2011 conferences
Summer/fall shutdown
New kicker magnet & power supplies installed INGRID modules assembly and installation Calorimeter modules installation completed ‐ full coverage at ND280
2nd run November 2010 – Summer 2011
Aim for 150 kW x 107 s by July 2011; currently > 110 kW 90% c.l. sensitivity sin22θ13 ~ 0.05
31 R.J.Wilson/Colorado State University
32 R.J.Wilson/Colorado State University
Similar to normal hierarchy T2K insensitive to matter effects
MINOS – Nu2010
33 R.J.Wilson/Colorado State University
34
Neutrino beam depends upon secondary beam geometry and hadron distribution
NA‐61/SHINE : dedicated hadron production experiment using T2K target to reduce
uncertainties in hadron production models
Pilot run in 2007 and high statistics run in 2009 : p(30 GeV) with Carbon thin
target and T2K replica target
preliminary results from 2007 used in T2K beam MC
MC=GFLUKA
35 R.J.Wilson/Colorado State University
3σ measurement
Japanese Fiscal Year (starts April 1 of CY)
36 R.J.Wilson/Colorado State University