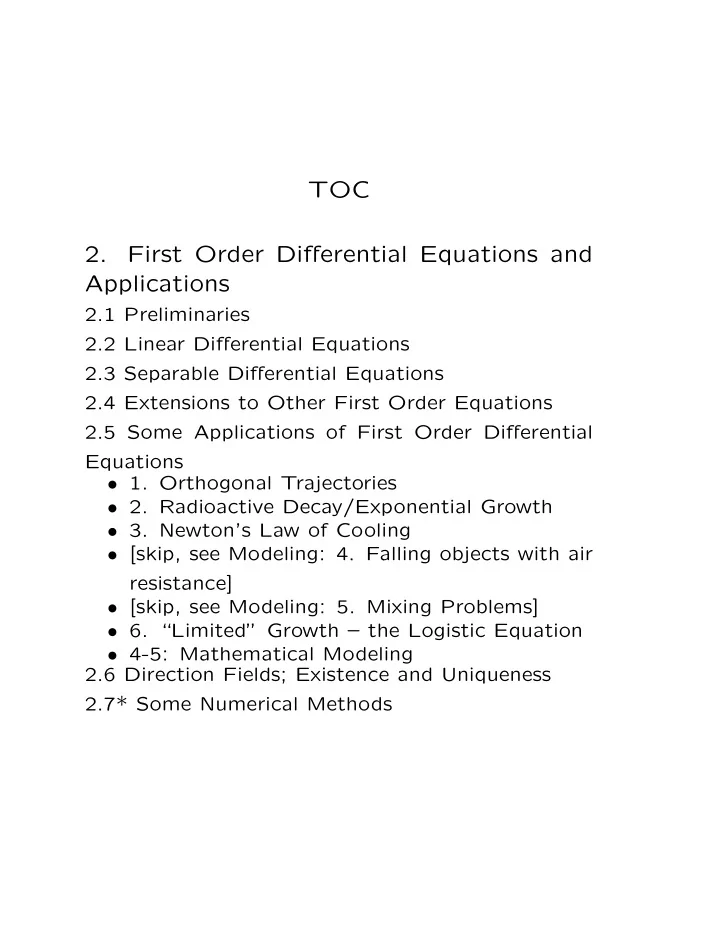
SLIDE 1 TOC 2. First Order Differential Equations and Applications
2.1 Preliminaries 2.2 Linear Differential Equations 2.3 Separable Differential Equations 2.4 Extensions to Other First Order Equations 2.5 Some Applications of First Order Differential Equations
- 1. Orthogonal Trajectories
- 2. Radioactive Decay/Exponential Growth
- 3. Newton’s Law of Cooling
- [skip, see Modeling: 4. Falling objects with air
resistance]
- [skip, see Modeling: 5. Mixing Problems]
- 6. “Limited” Growth – the Logistic Equation
- 4-5: Mathematical Modeling
2.6 Direction Fields; Existence and Uniqueness 2.7* Some Numerical Methods
SLIDE 2
Chapter 2, Part 2 2.5. Applications Orthogonal trajectories Exponential Growth/Decay Newton’s Law of Cooling/Heating Limited Growth (Logistic Equation) Miscellaneous Models
1
SLIDE 3
2.5.1. Orthogonal Trajectories Example: Family of circles, center at (1, 2): (x − 1)2 + (y − 2)2 = C DE for the family: y′ = −x − 1 y − 2
2
SLIDE 4
Circles
3
SLIDE 5
Family of lines through (1, 2): y − 2 = K(x − 1) DE for the family: y′ = y − 2 x − 1
4
SLIDE 6
Lines
5
SLIDE 7
y′ = −x − 1 y − 2 circles: slope of tangent line at (x, y) y′ = y − 2 x − 1 lines: slope of tangent line at (x, y) Negative reciprocals!!
6
SLIDE 8
Lines and circles
7
SLIDE 9
Given a one-parameter family of curves F(x, y, C) = 0. A curve that intersects each mem- ber of the family at right angles (or- thogonally) is called an orthogonal trajectory of the family.
8
SLIDE 10 If F(x, y, C) = 0 and G(x, y, K) = 0 are one-parameter families of curves such that each member of one fam- ily is an orthogonal trajectory of the
- ther family, then the two families
are said to be orthogonal trajec- tories.
9
SLIDE 11 A procedure for finding a family of
G(x, y, K) = 0 for a given family of curves F(x, y, C) = 0 Step 1. Determine the differential equation for the given family F(x, y, C) = 0.
10
SLIDE 12
Step 2. Replace y′ in that equa- tion by −1/y′; the resulting equa- tion is the differential equation for the family of orthogonal trajecto- ries. Step 3. Find the general solu- tion of the new differential equation. This is the family of orthogonal tra- jectories.
11
SLIDE 13
Examples 1. Find the family of orthogonal trajectories of: y3 = Cx2 + 2
12
SLIDE 14
y3 = Cx2 + 2, C = −1
13
SLIDE 15
Orthogonal trajectories: 3x2 + 2y2 + 8 y = C
14
SLIDE 16
Together:
15
SLIDE 17
2. Find the orthogonal trajecto- ries of the family of parabolas with vertical axis and vertex at the point (−1, 3).
16
SLIDE 18
Differential equation for the family:
17
SLIDE 19
Orthogonal trajectories: 1 2(x + 1)2 + (y − 3)2 = C
18
SLIDE 20
1 2(x + 1)2 + (y − 3)2 = C – ellipses
19
SLIDE 21
Parabolas and ellipses
20
SLIDE 22 2.5.2. Radioactive Decay/Exponential Growth Radioactive Decay “Experiment:” The rate of decay
- f a radioactive material at time
t is proportional to the amount of ma- terial present at time t. Let A = A(t) be the amount of radioactive material present at time t.
21
SLIDE 23
Mathematical Model dA dt = k A, k < 0 constant, A(0) = A0, the initial amount.
22
SLIDE 24
Solution: A(t) = A0 ekt. Half-life: T = ln 1/2 k = − ln 2 k .
23
SLIDE 25
This is often written equivalently as: dA dt = −r A, r > 0 constant, A(0) = A0, the initial amount. Solution: A(t) = a0e−rt r is the decay rate. Solution: A(t) = A0 e−rt. Half-life: T = ln 2 r .
24
SLIDE 26
Graph:
25
SLIDE 27
Example: A certain radioactive ma- terial is decaying at a rate propor- tional to the amount present. If a sample of 50 grams of the mate- rial was present initially and after 2 hours the sample lost 10% of its mass, find:
26
SLIDE 28
1. An expression for the mass of the material remaining at any time t.
27
SLIDE 29
2. The mass of the material after 4 hours.
28
SLIDE 30 3. How long will it take for 75%
t ≈ 26.32 hours 4. The half-life of the material. T ≈ 13.16 hours
29
SLIDE 31 Exponential Growth “Experiment:” Under “ideal” con- ditions, the rate of increase of a population at time t is proportional to the size of the population at time
P = P(t) be the size of the population at time t.
30
SLIDE 32
Mathematical Model dP dt = k P, k > 0 constant. P(0) = P0, the initial population. k is the growth rate.
31
SLIDE 33
Solution: P(t) = P0 ekt. Doubling time: T = ln 2 k .
32
SLIDE 34
Graph:
33
SLIDE 35
Example: Scientists observed that a small colony of penguins on a re- mote Antarctic island obeys the pop- ulation growth law. There were 1000 penguins initially and 1500 penguins 12 months later.
34
SLIDE 36
Penguin Colony
35
SLIDE 37
(a) Find the growth constant and give the penguin population at any time t. Answer: P(t) = 1000
3
2
t/12
36
SLIDE 38
(b) What is the penguin population after 3 years? (c) How long will it take for the penguin population to double in size? Answer: T = ln 2 k = 12 ln 2 ln(3/2) ≈ 20.5 mos
37
SLIDE 39
(d) How long will it take for the penguin population to reach 10,000 penguins? Answer: t = 12 ln(10) ln(3/2) ≈ 68 mos, 5.7 yrs.
38
SLIDE 40
Example: In 2000 the world popu- lation was approximately 6.1 billion and in the year 2010 it was approxi- mately 7.0 billion. Assume that the population increases at a rate pro- portional to the size of population.
39
SLIDE 41
(a) Find the growth constant and give the world population at any time t. Answer: P(t) = 6.1
7.0
6.1
t/10
40
SLIDE 42
(b) How long will it take for the world population to reach 12.2 bil- lion (double the 2000 population)? Answer: T ≈ 50.4 years (doubling time)
41
SLIDE 43
(c) The world population on 1/1/2020 is reported to be about 7.8 billion. What population does the formula in (1) predict for the year 2019? Answer: P(19) ≈ 7.92
42
SLIDE 44 Example: It is estimated that the arable land on earth can support a maximum of 30 billion people. Ex- trapolate from the data given in the previous example to estimate the year when the food supply becomes in- sufficient to support the world pop- ulation. Solve
7
6.1
t/10
=
30
6.1
t ≈ 116 year 2116
43
SLIDE 45 2.5.3. Newton’s Law of Cooling “Experiment:” The rate of change
- f the temperature of an object at
time t is proportional to the dif- ference between the temperature of the object u = u(t) and the (con- stant) temperature σ
rounding medium (e.g., air or wa- ter) du dt = k(u − σ)
44
SLIDE 46
Mathematical Model du dt = −k(u − σ), k > 0 constant, u(0) = u0, the initial temperature. Solution: u(t) = σ + [u0 − σ]e−kt
45
SLIDE 47
Graphs:
46
SLIDE 48
Example: A corpse is discovered at 10 p.m. and its temperature is determined to be 85o F. Two hours later, its temperature is 74o F. If the ambient temperature is 68o F, estimate the time of death.
47
SLIDE 49
u(t) = σ + [u0 − σ]e−kt = 68 + (85 − 68)e−kt = 68 + 17e−kt
48
SLIDE 50
2.5.6. “Limited” Growth – the Logistic Equation “Experiment:” Given a popula- tion of size M. The spread of an infectious disease at time t (or in- formation, or ...) is proportional to the product of the number of peo- ple who have the disease P(t) and the number of people who do not M − P(t).
49
SLIDE 51
Mathematical Model: dP dt = kP(M − P), k > 0 constant, = kMP − kP 2 P(0) = R (the number of people who have the disease initially) Solution: The differential equation is both separable and Bernoulli. Solution: P(t) = MR R + (M − R)e−Mkt
50
SLIDE 52
Graph:
51
SLIDE 53
Mathematical Modeling Examples:
52
SLIDE 54
1. A disease is spreading through a small cruise ship with 200 passen- gers and crew. Let P(t) be the number of people who have the dis- ease at time t. Suppose that 15 people had the disease initially and that the rate at which the disease is spreading at time t is proportional to the number of people who don’t have the disease.
53
SLIDE 55
a.
Give the mathematical model (initial-value problem) which describes the process.
54
SLIDE 56
b.
Find the solution. dP dt = k(200 − P), P(0) = 15 P(t) = 200 − 185e−kt.
55
SLIDE 57
c.
Suppose that 35 people are sick after 5 days. How many people will be sick after t days? After 15 days? P(t) = 200 − 185
33
37
t/5
. P(15) ≈ 69 P(t) = 100 t ≈ 27
56
SLIDE 58
lim
t→∞ P(t) and interpret the
33
37
t/5
. lim
t→∞ P(t) = 200; everyone gets sick.
57
SLIDE 59
2. A 1000-gallon cylindrical tank, initially full of water, develops a leak at the bottom. Suppose that the water drains off a rate proportional to the product of the time elapsed and the amount of water present. Let A(t) be the amount of water in the tank at time t.
SLIDE 60
a.
Give the mathematical model (initial-value problem) which describes the process.
58
SLIDE 61
b.
Find the solution. dA dt = ktA, k < 0, A(0) = 1000 A(t) = 1000ekt2/2.
59
SLIDE 62
- c. Given that 200 gallons of water
leak out in the first 10 minutes, find the amount of water, A(t), left in the tank t minutes after the leak develops. A(t) = 1000
4
5
t2/100
.
60
SLIDE 63
3. A 1000-gallon tank, initially containing 900 gallons of water, de- velops a leak at the bottom. Sup- pose that the water drains off a rate proportional to the square root of the amount of water present. Let A(t) be the amount of water in the tank at time t.
61
SLIDE 64
a.
Give the mathematical model (initial-value problem) which describes the process. dA dt = k √ A, k < 0, A(0) = 900
62
SLIDE 65
b.
Find the solution A(t) =
1
2kt + 30
2.
63
SLIDE 66
4. A disease is spreading through a small cruise ship with 200 passen- gers and crew. Let P(t) be the number of people who have the dis- ease at time t. Suppose that 15 people had the disease initially and that the rate at which the disease is spreading at time t is proportional to the product of the time elapsed and the number of people who don’t have the disease.
64
SLIDE 67
a.
Give the mathematical model (initial-value problem) which describes the process. dP dt = kt(200 − P), P(0) = 15
65
SLIDE 68
b.
Find the solution. dP dt = kt(200 − P), P(0) = 15 P(t) = 200 − 185e−kt2/2.
66
SLIDE 69
c.
Suppose that 35 people are sick after 5 days. How many people will be sick after t days? P(t) = 200 − 185
33
37
t2/25
.
67
SLIDE 70
68
SLIDE 71 Existence and Uniqueness Theo- rem: Given the initial-value prob- lem: y′ = f(x, y) y(a) = b. If f and ∂f/∂y are continuous on a rectangle R : a ≤ x ≤ b, c ≤ y ≤ b, then there is an interval a − h ≤ x ≤ a + h
- n which the initial-value problem
has a unique solution y = y(x).
69