
SLIDE 1
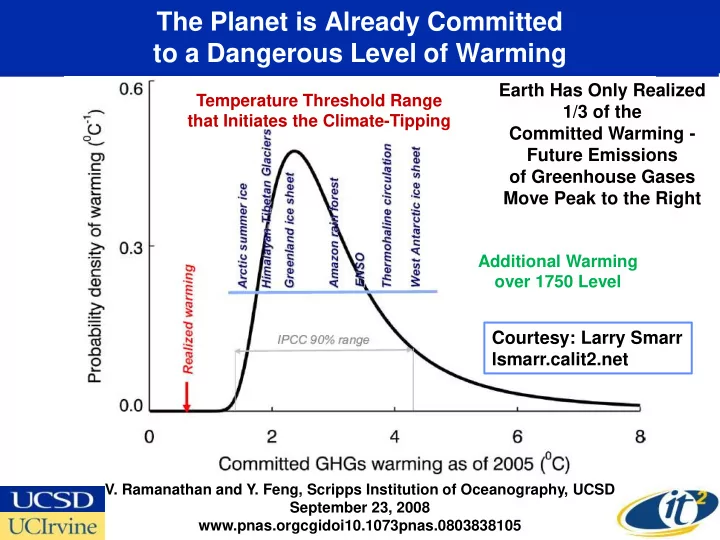
The Planet is Already Committed to a Dangerous Level of Warming
Temperature Threshold Range that Initiates the Climate-Tipping
- V. Ramanathan and Y. Feng, Scripps Institution of Oceanography, UCSD
September 23, 2008 www.pnas.orgcgidoi10.1073pnas.0803838105
Additional Warming
- ver 1750 Level
Earth Has Only Realized 1/3 of the Committed Warming - Future Emissions
- f Greenhouse Gases
Move Peak to the Right Courtesy: Larry Smarr lsmarr.calit2.net