
SLIDE 1
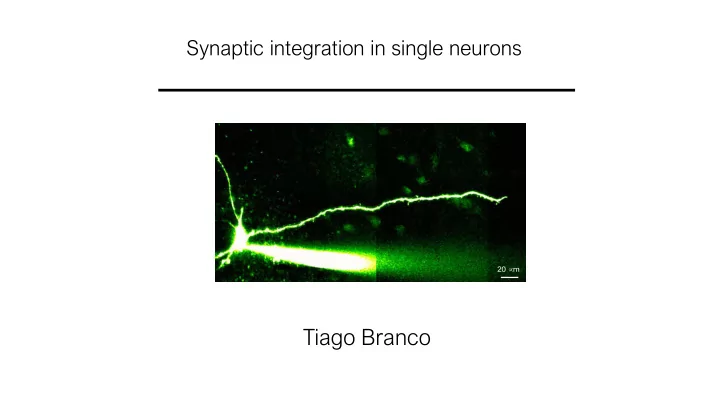
Synaptic integration in single neurons
Tiago Branco
20 µm
Tiago Branco Model Neuron Molecules dV i (V i V rest ) + j w - - PowerPoint PPT Presentation
Synaptic integration in single neurons 20 m Tiago Branco Model Neuron Molecules dV i (V i V rest ) + j w ij g j (t) = dt Why do we care? Input-output function of single neurons C dV g syn (V syn V rest ) = dt
20 µm
2 ms 1 nS
65 pA
RN Vrest CN in
voltage equals current times resistance (only at steady state)
NCN
At rest, the cell membrane is electrically equivalent to a parallel RC circuit
time
Growing phase:
Growing phase Decaying phase
Decaying phase:
mCm
Membrane potential responds to a step current with exponential rise and decay, governed by the membrane time constant, t m
20 ms
time
EPSP decay through resting (leak) K channels (determined by )
t m
steepest slope of EPSP peak of EPSP EPSP still rising
A PSP is slower than a PSC, and its decay is governed by the membrane time constant, .
2 ms 1 nS 65 pA 0.5 mV
Vrest Vthreshold 20 mV
excitatory synapse 2 excitatory synapse 1
EPSP1 EPSP1+2 EPSP2 by subtraction Linear Sublinear
+ gNav(VNav – Vrest) + gCav(VCav – Vrest) + gKv(Vkv – Vrest)
Wilfrid Rall
Space constant Voltage attenuation Electrotonic distance
Wilfrid Rall, 1964
Linear Sublinear
+ gNav(VNav – Vrest) + gCav(VCav – Vrest) + gKv(Vkv – Vrest)
Ih channels
from Llinas & Sugimori 1980
Na+ spikes Ca2+ spikes
Spruston et al., 1995 Stuart et al., Pflüger’s Archiv, 1993
Neocortical layer 5 pyramidal neurons
Stuart and Sakmann, Nature 1994 Stuart et al, J. Physiol. 1997
Distance from soma (µm) Dopamine neurons: high Na channel density and little branching. Layer 5 pyramidal neurons: moderate Na channel density and moderate branching; more branching in the tuft. Purkinje neurons: low Na channel density (none in dendrites) and extensive branching. Vetter et al, J. Neurophysiology, 2001
1 2 4 3 5 6 7 8 4 1 2 5 3 8 6 7 5 3 6 1 4 8 2 7 5 7 8 6 3 2 1 4