
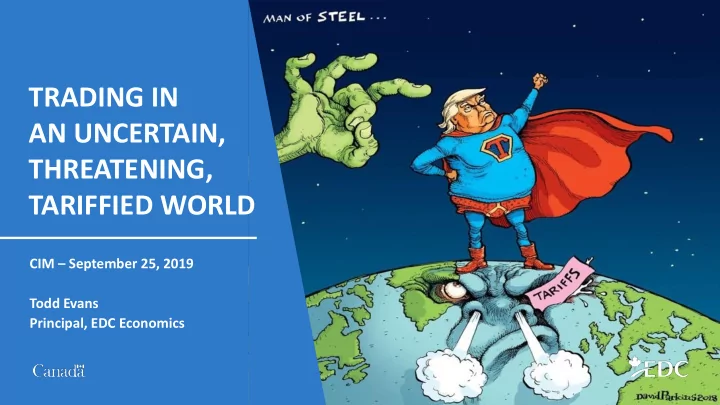
SLIDE 1
TRADING IN AN UNCERTAIN, THREATENING, TARIFFIED WORLD
CIM – September 25, 2019 Todd Evans Principal, EDC Economics
THREATENING, TARIFFIED WORLD CIM September 25, 2019 Todd Evans - - PowerPoint PPT Presentation
TRADING IN AN UNCERTAIN, THREATENING, TARIFFIED WORLD CIM September 25, 2019 Todd Evans Principal, EDC Economics OVERVIEW 1. Challenging trade environment for Canadian exporters 2. Global Trade becoming more regional 3. Outlook for
CIM – September 25, 2019 Todd Evans Principal, EDC Economics
2
3
4
50 100 150 200 250 300 2007 2008 2009 2010 2011 2012 2013 2014 2015 2016 2017 2018 2019 New populism Financial crisis
Global economic policy uncertainty index
5
1 2 3 4 5 6
2015 2016 2017 2018 2019
Industrial production World trade volumes
Year-over-year % change
Source: Haver Analytics
6
…slowdown synchronized. Slowing growth since 2018…
Global purchasing managers index >50 = expansion Purchasing managers index Heatmap: green >50; red <50
49 50 51 52 53 54 55 2016 2017 2018 2019
May – Aug contraction
7
8
69.8 55 60 65 70 75 80 85 90
1999 2000 2001 2002 2003 2004 2005 2006 2007 2008 2009 2010 2011 2012 2013 2014 2015 2016 2017 2018 2019
Historical average
EDC’s Trade Confidence Index
73.7
The Index score represents the responses from five different components
9
Source: Santoni, Gianluca, Dari Taglioni (2015)
2000-18, cumulative nominal percent change
50 100 150 200 250 300 2000 2002 2004 2006 2008 2010 2012 2014 2016 2018
Imports Inward Investment Exports Outward Investment 2000-18 CAGR CDIA 7.4% FDI 5.8% Imports 2.9% Exports 1.8%
2000-18, cumulative nominal percent change
20 40 60 80 100 120 2000 2002 2004 2006 2008 2010 2012 2014 2016 2018
Merchandise Goods Services 2000-18 CAGR Goods 1.7% Services 4.0% Canada 2018 Exports Goods $584 bn Services $121 bn
Canada 2016, billions of dollars
100 200 300 400 500 600 700
Foreign affiliate sales Exports Goods Services
626 658
14
Annual US trade balance in goods and services, billions USD
50 1999 2000 2001 2002 2003 2004 2005 2006 2007 2008 2009 2010 2011 2012 2013 2014 2015 2016 2017 2018
Canada Mexico China
Source: Bureau of Economic Analysis, US Department of Commerce.
China joins WTO December 2001
16
10 20 30 40 50 60 70 80 90 100
Share of US goods imports from China covered by special protection (%)
Percent
68.5%
50.6%
96.8%
Source: Peterson Institute of International Economics.
8.1%
2017
US – China quarterly merchandise trade, billions USD
20 40 60 80 100 120 140 160 1999 - Q1 2001 - Q1 2003 - Q1 2005 - Q1 2007 - Q1 2009 - Q1 2011 - Q1 2013 - Q1 2015 - Q1 2017 - Q1 2019 - Q1
US Imports from China US Exports to China
Source: US Bureau of Economic Analysis.
18
1. Guarantees for IP and investment protection requires changes to Chinese domestic laws 2. So does establishment of trade enforcement mechanisms
19
20
CANADA’S GLOBAL ‘TRADE’ RELATIONSHIP GOES WELL BEYOND MERCHANDISE EXPORTS
Source: EDC Economics, Statistics Canada.
Goods Exports = $584 bn Service Exports = $121 bn Direct Investment Stock = $1,340 bn Foreign Affiliate Sales = $658 bn Goods Imports = $596 bn Service Imports = $146 bn Direct Investment Stock = $970 bn Foreign Affiliate Sales = $1,104 bn A $C 5.5 trillion commercial relationship!
21
0.8
Source: EDC Global Economic Outlook, Fall 2019.
US and Canada business investment: structures and equipment (year/year % change)
5 10 15 2012 - Q1 2013 - Q1 2014 - Q1 2015 - Q1 2016 - Q1 2017 - Q1 2018 - Q1 2019 - Q1 percent
United States Canada Greater exposure to global trade means a bigger impact on Canadian investment
Source: EDC Economics, Haver Analytics.
23
2018 2019 (f) 2020 (f) Goods 7% 3% 3% Services 6% 4% 4%
Source: EDC Global Export Forecast Outlook, Spring 2019.
24
Protectionist “new normal” Normalization
Trump re-elected
CUSMA
Canada 1st-mover over US in CETA, CPTPP US rejoins CPTPP US-China dispute Escalates → Canada collateral damage Agreement → Chinese restrictions on Canada lifted ROW US battles EU, Japan, Mexico No Brexit WTO Reform stalls, dispute settlement inactive “Ottawa Group” makes progress So what?
→ Ad hoc support needed (S/A, canola)
Outward push continues
Principal, EDC Economics, Export Development Canada Email: TEvans@edc.ca
ed edc.trade/economic-insights
@ExportDevCanada