www.theFloridaScorecard.org Downloadable charts Data is - - PowerPoint PPT Presentation
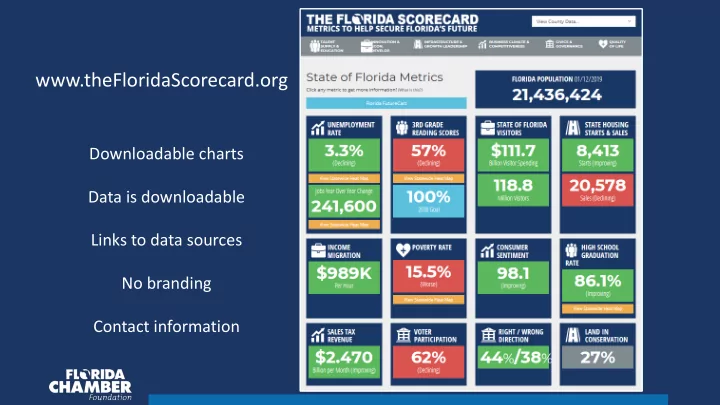
www.theFloridaScorecard.org Downloadable charts Data is downloadable Links to data sources No branding Contact information Florida Year-over-Year Job Creation (Thousands) 400 200 0 2008 2009 2010 2011 2012 2013 2014 2015 2016
- 549.4
- 600
- 400
- 200
200 400
2008 2009 2010 2011 2012 2013 2014 2015 2016 2017 2018
Florida Year-over-Year Job Creation
(Thousands)
Alaska: -0.2% Hawaii: 2.0%
Job Growth – November 2017 to November 2018 U.S. – 1.7%
Data Source: Florida Department of Economic Opportunity
Job Creation
November 2017 to November 2018
Florida Job Creation Rate: 2.8% U.S. Job Creation Rate: 1.7%
Top Counties for Jobs: Orange 32,713 Broward 20,185 Palm Beach 19,655 Top Growth Rate Counties: Seminole, Orange, Lake, Osceola – all 4.6%
5 Florida Counties Lost Jobs over past year
Job Growth 2007 to 2017
U.S. Job Growth Rate: 6.3% Florida’s Job Growth Rate: 6.9%
Top Counties – Jobs
- 1. Orange
128,868
- 2. Miami-Dade
107,552
- 3. Broward
45,880
- 4. Palm Beach
36,471
- 5. Duval
36,406 Top Counties - Job Growth
- 1. Sumter
40.0%
- 2. St. Johns
28.8%
- 3. Flagler
26.3%
- 4. Osceola
24.9%
- 5. Walton
24.7% Data Source: Bureau of Labor Statistics, QCEW Annual Data 26 Florida Counties Lost Jobs between 2007 and 2017 – 38.8% 53.2% of U.S. Counties Lost Jobs between 2007 and 2017
85+ 80- 84 75- 79 65- 69 60- 64 55- 59 50- 54 45- 49 40- 44 35- 39 30- 34 25- 29 20- 24 15- 19 0- 14
0% 20% 40% 60% 80% Age Group
Florida Growth to 2030 by Age Group
70- 74
Florida’s next 5 million People
8 Counties to account for 56.9% of Population Increase:
- 1. Miami-Dade
- 2. Orange
- 3. Hillsborough
- 4. Broward
- 5. Palm Beach
- 6. Lee
- 7. Duval
- 8. Osceola
Top Number: Population Increase Bottom Number: Percentage Increase
Source: FL Demographic Estimating Conference & BEBR FL Population Studies
Net Migration to Florida
Alaska 494 Hawaii
- 368
Puerto Rico 26,204
6,713
18,854
Florida County 3rd Grade Reading Scores 2018
Number is percent of 3rd Graders reading at Grade Level Statewide: 95,232 public school 3rd Graders not reading at grade level in 2018.
Data Source: Florida Department of Education
Florida
January 2018 January 2019
Variables used in Florida’s Leading Economic Index
Florida Consumer Sentiment Florida Trade-Weighted Dollar Open Jobs Housing Starts
Variables used in Florida’s Leading Economic Index
- Florida Initial Unemployment Claims
(Federal Reserve-FRED)
- Commercial Airport Activity
(FAA-ATADS)
- Interest Rate Yield Spread
(Federal Reserve-FRED)
60,000 80,000 100,000 120,000 140,000
Commercial Carrier Activity
Carrier 12 per. Mov. Avg. (Carrier)
Housing Starts
20 40 60 80 100 120
2010 2011 2012 2013 2014 2015 2016 2017 2018
Florida Trade-Weighted Dollar
Yield Spread – 10s minus 2s
5,216 Initial Claims – 12/29/2018. 14,698 furloughed Florida workers according to Center for American Progress
Initial Unemployment Claims - Florida
The Florida Leading Index forecasts the Job Creation in Florida for the upcoming 6 months. This addition to the Florida Scorecard forecasts the probability that Florida will be in a recession in the next 9 months.
2018 additions to The Flo lorida Scorecard
January 2018 January 2019
0% 2% 4% 6% 8% 10% 12% 14% 16%
60 70 80 90 100 110 120 130 140 150 160 170 180 190 200 210
Florida Chamber Foundation Jobs Forecast for 2019 (thousands)
2019 Forecast
150,000 Jobs
70% Probability between 130,000 and 170,000 40% Probability between 140,000 and 160,000
2019 Forecasts
- 1. Jobs Created – 150,000
- 2. Population Increase – 330,000
- 3. Top Industry Growth Rates:
- 1. Construction
- 2. Professional & Business Services
- 3. Health Services