
SLIDE 1
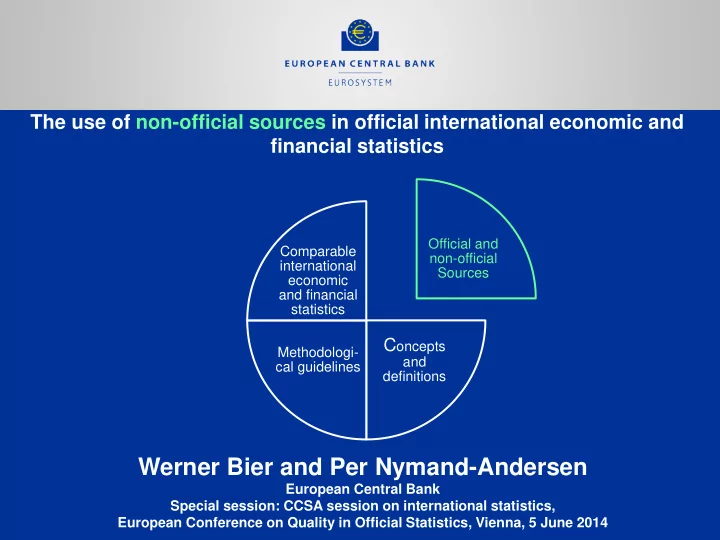
The use of non-official sources in official international economic and financial statistics
Werner Bier and Per Nymand-Andersen
European Central Bank Special session: CCSA session on international statistics, European Conference on Quality in Official Statistics, Vienna, 5 June 2014 Official and non-official Sources
Concepts
and definitions Methodologi- cal guidelines Comparable international economic and financial statistics