
SLIDE 1
1
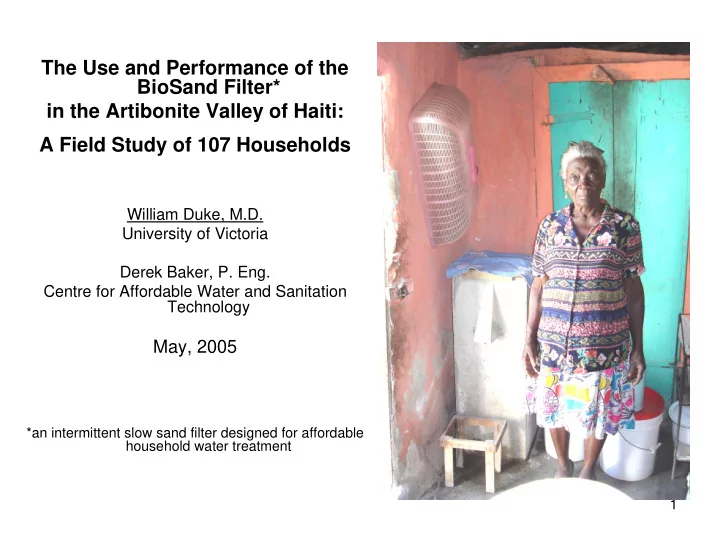
The Use and Performance of the BioSand Filter* in the Artibonite Valley of Haiti: A Field Study of 107 Households
William Duke, M.D. University of Victoria Derek Baker, P. Eng. Centre for Affordable Water and Sanitation Technology
May, 2005
*an intermittent slow sand filter designed for affordable household water treatment