The twin cycle hypothesis Substantial weight loss in people with - - PowerPoint PPT Presentation

the twin cycle hypothesis
SMART_READER_LITE
LIVE PREVIEW

The twin cycle hypothesis Substantial weight loss in people with - - PowerPoint PPT Presentation

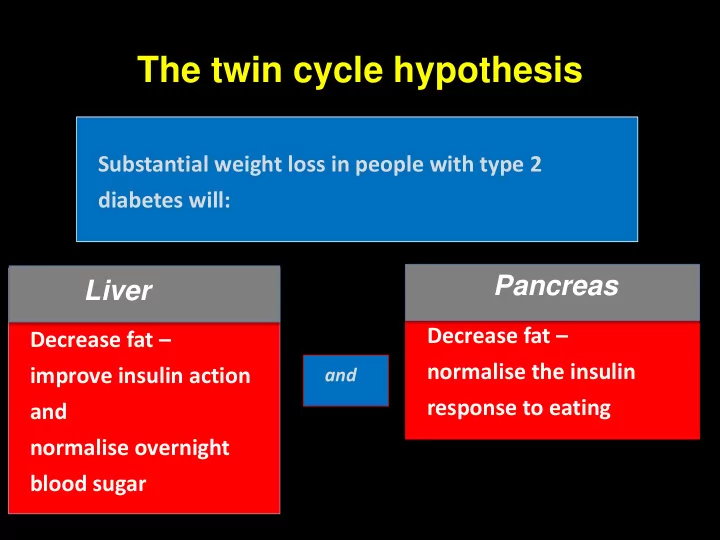
The twin cycle hypothesis Substantial weight loss in people with type 2 diabetes will: Pancreas Liver Decrease fat Decrease fat normalise the insulin improve insulin action and response to eating and normalise overnight blood sugar


slide-1
SLIDE 1

Decrease fat – normalise the insulin response to eating Decrease fat – improve insulin action and normalise overnight blood sugar

The twin cycle hypothesis

Substantial weight loss in people with type 2 diabetes will:

and

Liver Pancreas

slide-2
SLIDE 2

2 4 6 8

5 10 15 20

Fat %

2 4 6 8 5 10 15

Insulin sensitivity Index

2 4 6 8

0.0 0.2 0.4 0.6 0.8

a

Week

First phase insulin secretion

2 4 6 8 3 6 9 12 Week

Fat %

The Counterpoint study – Type 2 diabetes, 800kcal diet Liver Pancreas

2 4 6 8

4 6 8 10

Week Fasting glucose (mmol/l)

slide-3
SLIDE 3

Reversibility of type 2 diabetes

The pathophysiological defects in the liver and pancreas are reversible – if diabetes duration <4yr

Week 0 Week 1 Week 4 Week 8 20 40 60 80 100

% Insulin suppression

  • f HGP

2 4 6 8 0.0 0.2 0.4 0.6 0.8 1.0

First phase insulin response (nmol/min/m2)

Can long duration type 2 diabetes also be reversed?

0 1 4 8

slide-4
SLIDE 4

The Counterbalance Study –

Counteracting BetA cell failure by Long term Action to Normalize Calorie intakE

Questions: Can people with longer duration type 2 diabetes reverse to normal? Is the reversal of type 2 diabetes durable if body weight remains stable?

slide-5
SLIDE 5

Very low calorie diet

Protocol for CounterBalance study

T2DM < 4 yr

0 1 4 8 10 + 6 months

Weeks

T2DM > 8 yr

Stepped return to normal eating

Weight maintenance

8 10

slide-6
SLIDE 6

Counterbalance Subjects

Age (yr) 52.1 ± 2.6 61.6 ± 2.0 Weight (kg) 99.0 ± 3.7 96.9 ± 3.8 BMI (kg/m2) 34.6 (27.6-38.0) 33.0 (29.4-45.7) FPG (mmol/l) 9.6 ± 0.7 13.4 ± 0.8 HbA1c (mmol/mol) 55 ± 2 70 ± 4 Fasting insulin 17.4 (3.9-48.9) 7.0 (4.1-31.9) Diabetes duration 0-4y 8-23y (n=15)

(n=14) Steven et al Diabetic Med 2015

slide-7
SLIDE 7

Results: weight loss during diet

Weight loss: 14.6 ± 0.8 % vs. 14.5 ± 0.7 %

p=0.662

slide-8
SLIDE 8

Fasting plasma glucose during diet

Steven et al Diabetic Med 2015

slide-9
SLIDE 9

By diabetes duration

Spearman 0.501; p=0.006 <4 y 5.8 mM 8-12 y 6.2 mM >12 y 10.6 mM

Steven et al Diabetic Med 2015