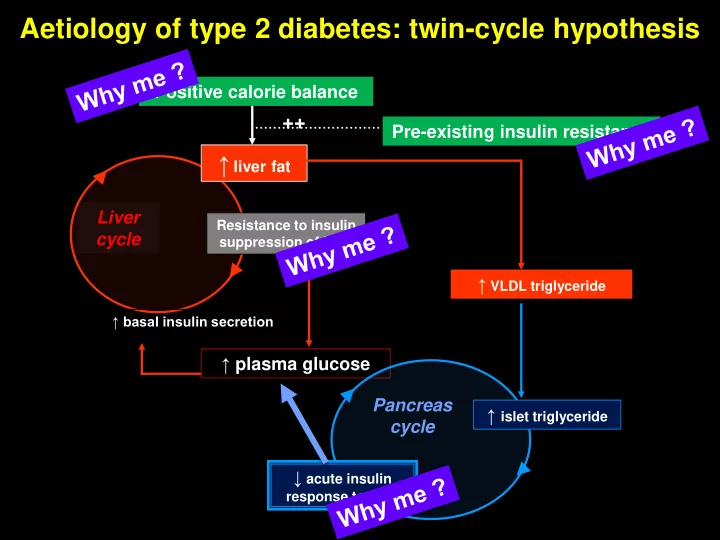
SLIDE 1 Aetiology of type 2 diabetes: twin-cycle hypothesis
Positive calorie balance
↑ liver fat
↑ basal insulin secretion Resistance to insulin suppression of HGP
↑ VLDL triglyceride ↑ plasma glucose Liver cycle Pancreas cycle ↑ islet triglyceride Pre-existing insulin resistance
++
↓ acute insulin
response to food
- Taylor. Diabetologia 2008; 51: 1781
SLIDE 2
BMI distribution of participants – Start of UK Prospective Diabetes Study
Taylor & Holman, Clin Sci 128: 405-410 2015
SLIDE 3
BMI distribution of individuals with type 2 diabetes 20 25 30 40 35
Taylor & Holman, Clin Sci 128: 405-410 2015
SLIDE 4
Personal vs population
20 35 30 25 40 BMI
A C B Individuals Individuals Individuals
The top panel shows the BMI distribution of individuals at diagnosis of type 2 diabetes. However, a generation ago, the alter egos of those people would have been ~15 mg lighter and would not have had diabetes (blue dots). OR – If those people with T2DM lose 15kg, they lose their type 2 diabetes
Taylor & Holman, Clin Sci 128: 405-410 2015
SLIDE 5 Personal vs population
20 35 30 25 40 BMI
A C B Individuals Individuals Individuals
Take 3 individuals for example. Each lost 15kg and reversed their diabetes. But by BMI criteria they remain obese,
respectively. Each individual must have crossed a threshold of fat mass, personal to them.
Taylor & Holman, Clin Sci 128: 405-410 2015
SLIDE 6
Personal vs population
20 35 30 25 40 BMI
A C B Individuals Individuals Individuals
explains the “Why me” factor – indivduals have personal capacity to store fat safely. If the PFT is exceeded, T2DM slowly develops.
Taylor & Holman, Clin Sci 128: 405-410 2015
SLIDE 7
20 40 60 80
<10 10-20 20-30 >30 Percentage reversing diabetes
Amount of weight lost and effect on reversal of diabetes – 92 people after bariatric surgery
Steven, Carey, Small & Taylor; Diabetic Med 2014
Weight loss (%)