altitude and vertical thermal structure of the atmosphere
play

Altitude and vertical thermal structure of the atmosphere - PowerPoint PPT Presentation

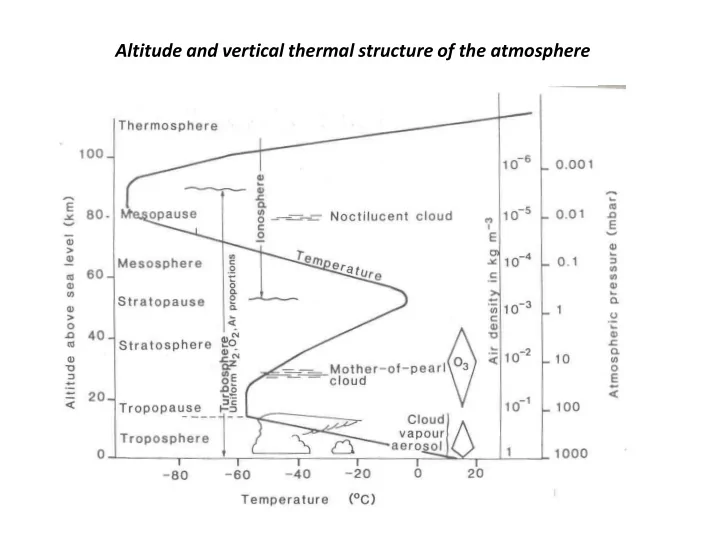
Altitude and vertical thermal structure of the atmosphere Exponential decay of Pressure with Height Approximate relationship: P=P 0 exp(-z/8100) Where P 0 =1013 mb and 8100 m = e- folding distance or scale height Common Unit Conversions and


  1. Altitude and vertical thermal structure of the atmosphere

  2. Exponential decay of Pressure with Height Approximate relationship: P=P 0 exp(-z/8100) Where P 0 =1013 mb and 8100 m = e- folding distance or “scale height”

  3. Common Unit Conversions and Conventions in Meteorology 5 • Temperature: C ( F 32 ) 9 9 F C 32 5 K C 273 . 15 • Pressure: Surface pressure is usually measured in mb or in. Hg and adjusted mathematically to the pressure that would be read if the station were at sea level. 1013 mb = 101300 Pa = 1013 hPa = 1 atm = 760 mm Hg = 29.92 in Hg • Winds: Compass rose with wind blowing FROM 0 degrees denoting a North Wind, 90 an East Wind, 180 a south wind and 270 a West wind 1 kt = 1.15 mph ; 1 mph = 1.61 km/hr • Lengths Large lengths usually in km or mi; small dimensions almost always in meter fractions m = 3.28 ft; 1 mi=5280 ft; 1 mi=1.61 km; 1 mm= 1x10 -3 m; µm= 1x10 -6 m • Areas 1 sq. mi = 2.6 km 2 =2.6x10 6 m 2 ; 1 acre=4087 m 2 • Volumes 1m 3 = 1x10 9 mm 3 ; 1 ml=1cm 3 =1x10 -6 m 3 • Energy The energy required to heat 1 ml of water 1 degree C is a calorie – a food Calorie (large C) is 1000 calories (small c) 1 cal = 4.184 J • Power Power expresses the rate of energy W=1 J/s

  4. The Station Model for surface observations WIND Wind is plotted in increments of 5 knots (kts), with the outer end of the symbol pointing toward the PRESENT WEATHER: direction from which the wind is blowing. The wind speed is determined by adding up the total of flags, lines, and half-lines, each of which have the following individual values: Indicates presently occuring precipitation. Other unusual phenomena may also be indicated in Flag: 50 kts text report. Visibility is often indicated to the left Line: 10 kts of this symbol. Half-Line: 5 kts If there is only a circle depicted over the station with no wind symbol present, the wind is calm. Below are some sample wind symbols:

  5. PRESSURES and TRENDS Sea-level pressure is plotted in tenths of millibars (mb), with the leading 10 or 9 omitted. For reference, 1013 mb is equivalent to 29.92 inches of mercury. Below are some sample conversions between plotted and complete sea-level pressure values: PRESENT SKY COVER: 410: 1041.0 mb Usually, but not always in quarters of cloud 103: 1010.3 mb cover. Traditionally observed in eighths. 987: 998.7 mb 872: 987.2 mb The pressure trend has two components, a number and symbol, to indicate how the sea-level pressure has changed during the past three hours. Trends are often omitted The number provides the 3-hour change in tenths of millibars, while the symbol provides a graphic illustration of how this change occurred. Below are the meanings of the pressure trend symbols:

Download Presentation
Download Policy: The content available on the website is offered to you 'AS IS' for your personal information and use only. It cannot be commercialized, licensed, or distributed on other websites without prior consent from the author. To download a presentation, simply click this link. If you encounter any difficulties during the download process, it's possible that the publisher has removed the file from their server.

Recommend


More recommend