SLIDE 1
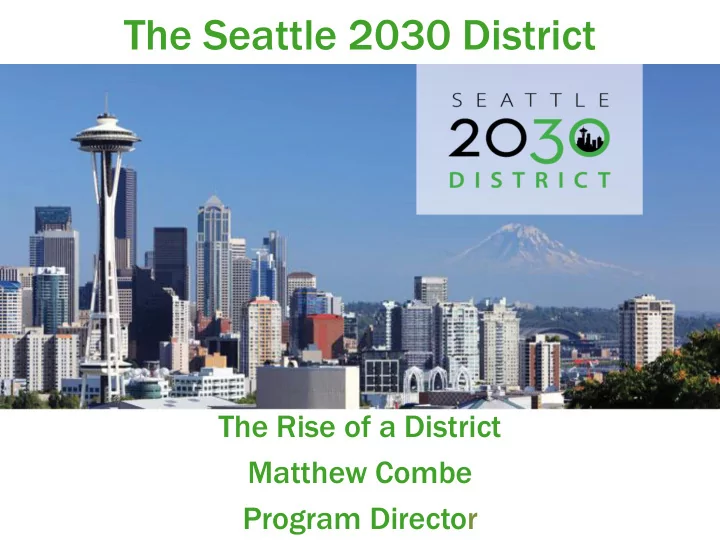
The Seattle 2030 District
The Rise of a District Matthew Combe Program Director
SLIDE 2
SLIDE 3
The National Context
SLIDE 4
SLIDE 5
SLIDE 6
SLIDE 7
SLIDE 8
SLIDE 9
SLIDE 10
SLIDE 11
Current Boundary
SLIDE 12
Performance Targets – Existing Buildings
SLIDE 13 Performance Targets
National EUI compared to actual EUI Regional Baseline Regional Baseline
SLIDE 14
Seattle’s GHG Inventory
SLIDE 15
New York’s GHG Inventory
SLIDE 16 Water: A Deeper Dive
– 355 Events – 154 MG of sewage into
SLIDE 17
Aggressive GSI Goals
SLIDE 18
The 2030 Water and Storm Water Calculator
SLIDE 19
Progress
144 Buildings
SLIDE 20
Progress
35% of the Total Square Footage
SLIDE 21
Aggregated Performance Shared Buildings
23% Reduction in Energy
SLIDE 22
Aggregated Performance Shared Buildings
7.5% Reduction in Water
SLIDE 23
Aggregated Performance Shared Buildings
5.4% Reduction in Transportation Emissions
SLIDE 24
Aggregated Performance Total District
9% Reduction in Energy
SLIDE 25
Aggregated Performance Total District
2.5% Reduction in Water
SLIDE 26
Aggregated Performance Total District
8.6% Reduction in Transportation Emissions
SLIDE 27 Benefits For Building Owners, Managers and Developers
Utilize special Financing programs Improve competitive positioning Access exclusive incentives, discounts & programs Receive comparative analysis reports
SLIDE 28
Building Assessment
SLIDE 29
Portfolio Comparisons
SLIDE 30
Portfolio Comparisons
SLIDE 31
Portfolio Progress Report
SLIDE 32
Property Comparisons
SLIDE 33
Property Comparisons
SLIDE 34
Property Comparisons
SLIDE 35
Property Comparisons
SLIDE 36
Property Comparisons
SLIDE 37
Property Comparisons
SLIDE 38
Portfolio Analysis
SLIDE 39 Energy Load Profile Assessment
Seattle 2030 District Office Load Profile
SLIDE 40 Seattle 2030 District Office Load Profile
Energy Load Profile Assessment
SLIDE 41 Seattle 2030 District Office Load Profile
Energy Load Profile Assessment
SLIDE 42 Seattle 2030 District Office Load Profile
Energy Load Profile Assessment
SLIDE 43
Access Exclusive Incentives, Discounts & Programs
SLIDE 44 FirstViewTM Reports
Energy Consumption By End Use PEER Building Comparison EUI by End Use
SLIDE 45
Smart Building and Energy Solutions
SLIDE 46
Switch Automation
SLIDE 47
Switch Automation
SLIDE 48 Wegowise Pro
*For the first 10% of each District’s floor space
SLIDE 49
Small Commercial Toolkit
SLIDE 50
Seattle 2030 & Nissan Partnership
SLIDE 51
2030 Districts Network
SLIDE 52 2030 Districts Network
100M Squ quare re Feet et Commit mitted ed
SLIDE 53 More information
- For more information please visit our
website at: 2030districts.org/Seattle
- Follow us on Twitter @SEA2030
- matthewcombe@seattle2030districts.org
SLIDE 54
Thank you!