NRELs Research Support Facility: An Energy Performance Update - - PowerPoint PPT Presentation

nrel s research support facility an energy performance
SMART_READER_LITE
LIVE PREVIEW

NRELs Research Support Facility: An Energy Performance Update - - PowerPoint PPT Presentation

Innovation for Our Energy Future NRELs Research Support Facility: An Energy Performance Update Shanti Pless- Senior Research Engineer Chad Lobato Research Engineer Joe Drexler Chief Engineer for Site Operations and Maintenance Paul


slide-1
SLIDE 1

NREL is a national laboratory of the U.S. Department of Energy, Office of Energy Efficiency and Renewable Energy, operated by the Alliance for Sustainable Energy, LLC.

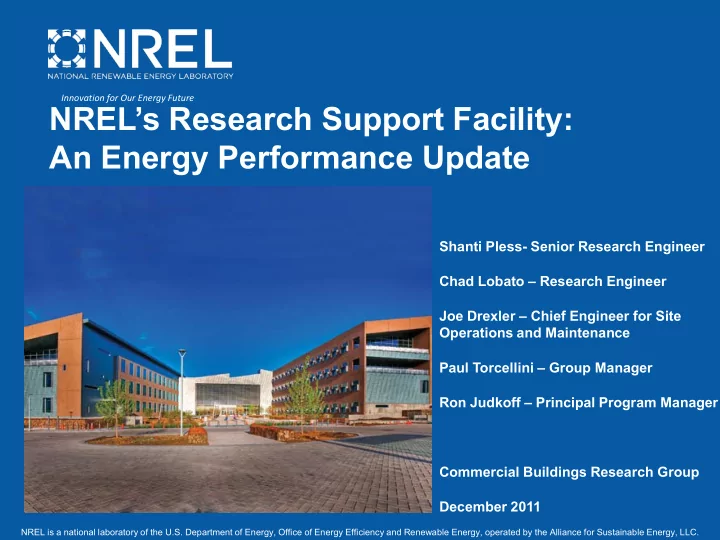
NREL’s Research Support Facility: An Energy Performance Update

Shanti Pless- Senior Research Engineer Chad Lobato – Research Engineer Joe Drexler – Chief Engineer for Site Operations and Maintenance Paul Torcellini – Group Manager Ron Judkoff – Principal Program Manager Commercial Buildings Research Group December 2011

Innovation for Our Energy Future

slide-2
SLIDE 2

Innovation for Our Energy Future

20 40 60 80 100 120 140 Old NREL/DOE Leased Office Space Typical Denver Office Building ENERGY STAR 75 Office Building Average LEED Office Building ENERGY STAR 90 Office Building EPA Region 8 Office Denver, CO RSF RSF Renewable Production Annual EUI (kBtu/ft2) Site Mounted PV Roof Mounted PV Data Center Whole Building

Energy Efficiency Design Requirements

2

  • 25 kBtu/ft2/yr for standard office space occupant density and data center

loads

  • Demand side energy use goal, not including renewables
  • Normalized up to 35.1 kBtu/ft2/yr for better space efficiency and to account for full data

center load

  • On site renewables sized to offset site energy use to reach net zero annual

use

Credit: Chad Lobato/NREL

References:

https://www.energystar.gov/index.cfm?c=new_bldg_design.bus_target_finder http://eere.buildinggreen.com/mtxview.cfm?CFID=46438782&CFTOKEN=31996638 http://femp.buildinggreen.com/overview.cfm?ProjectID=864

slide-3
SLIDE 3

Innovation for Our Energy Future

Performance Statements

3

  • The RSF complex (RSF, RSF II, parking garage, and

associated site lighting) was designed to produce more

  • n-site renewable energy than it uses over the course
  • f a typical weather year, when accounted for at the

site.

  • For the first year of occupancy, the measured whole

building energy use is meeting the predicted annual energy use intensity targets.

  • 35.4 kBtu/ft2 measured vs. 35.1 kBtu/ft2 predicted
  • Continued performance monitoring and occupant

education is required to ensure annual energy use goals will continue to be met.

slide-4
SLIDE 4

Innovation for Our Energy Future

So How Is It Performing?

4

For the last 14 months, we have been comparing the measured end uses to the model end uses:

  • Annual EUI close to model
  • 35.4 kBtu/ft2 compared to the goal of 35.1 kBtu/ft2
  • Winter Daytime lighting meeting the model predictions
  • 25-30 kW of lighting (typical office building would use 170 kW)
  • 35-40 kW of lighting during the summer due to high sun angles
  • Addressing nighttime cleaning and staff lighting operation
  • Significantly below daytime plug load predictions
  • Staff education programs have engaged occupants as active participants
  • Continuous occupant education needed to reduce nighttime plug loads
  • Fans and Pumps meeting the model predictions
  • Nighttime loads half of model predictions
  • Datacenter meeting the model predictions during cooler months
  • PUE of 1.1 - 1.15 during cooler months
  • Average PUE of 1.21 for summer 2011
  • Refining hot aisle containment strategy to reduce data center chilled water use
  • Rooftop PV meeting model predictions
  • 32,800 kWh Dec production compared to 29,000 kWh modeled
  • Heating use close to model
  • Internal gains of occupants and plugs less than modeled
  • Cooling use close to model
  • Building cooling is below the model prediction
  • Total cooling, including additional datacenter chilled water use, is slightly higher than predicted
slide-5
SLIDE 5

Innovation for Our Energy Future

Measured Versus Modeled Monthly and Cumulative EUI

5 Credit: Chad Lobato/NREL 4 8 12 16 20 24 28 32 36

0.0 0.5 1.0 1.5 2.0 2.5 3.0 3.5 4.0 4.5 Model RSF PV Model RSF PV Model RSF PV Model RSF PV Model RSF PV Model RSF PV Model RSF PV Model RSF PV Model RSF PV Model RSF PV Model RSF PV Model RSF PV Model RSF PV Model RSF PV Oct 2010 Nov 2010 Dec 2010 Jan 2011 Feb 2011 Mar 2011 Apr 2011 May 2011 Jun 2011 Jul 2011 Aug 2011 Sep 2011 Oct 2011 Nov 2011

Annual EUI (kBtu/ft2) Monthly EUI (kBtu/ft2) PV Data Center Mechanical Systems Plug Loads Lighting Heating Cooling Model Annual EUI RSF Annual EUI

The PV system is sized for an annual EUI of 35.1 kBtu/ft2.

Note: The annual EUI values are demand side values and do not include the

slide-6
SLIDE 6

Innovation for Our Energy Future

Energy Modeling

End Use kBtu/ft2 Space Heating 8.58 Space Cooling 0.85 Pumps 0.48 Ventilation Fans 1.88 Domestic Hot Water 0.90 Exterior Lights 0.12 Lights 2.07 Office Plug Loads 7.87 Task Lights 0.10 Data Center 12.11 Data Center Cooling 0.02 Data Center Fans 0.20

Credit: Stantec Credit: Chad Lobato/NREL Space Heating 24% Space Cooling 3% Pumps 1% Ventilation Fans 5% Domestic Hot Water 3% Exterior Lights 0% Lights 6% Office Plug Loads 22% Task Lights 0% Data Center 35% Data Center Cooling 0% Data Center Fans 1%

NREL RSF Energy Use Breakdown

slide-7
SLIDE 7

Innovation for Our Energy Future

RSF Complex Update

7

  • RSF opened June 2010
  • ~80% occupied
  • 14 of 14 wings occupied
  • 650 of 820 occupants
  • Roof-mounted PV installed and operational
  • Visitor parking lot and PV installation complete
  • PV operational July 2011
  • RSF II opened November 2011
  • Parking garage construction underway
  • Winter 2011 completion

NREL/PIX 17845 NREL/PIX 17904

slide-8
SLIDE 8

NREL is a national laboratory of the U.S. Department of Energy, Office of Energy Efficiency and Renewable Energy, operated by the Alliance for Sustainable Energy, LLC.

Photovoltaic System

NREL/PIX 19094

slide-9
SLIDE 9

Innovation for Our Energy Future 0.00 0.05 0.10 0.15 0.20 0.25 0.30 0.35 0.40 0.45 0.50 0.55 0.60 0.65 2 4 6 8 10 12 14 16 18 20 22 24 Power Density (W/ft2) Time of Day Model Average December 2010 January 2011 February 2011 March 2011 April 2011 May 2011 June 2011 July 2011 August 2011 September 2011 October 2011 November 2011 Credit: Chad Lobato/NREL

December 2010 – November 2011 Plug Load Power Density

Note: The elevators are included in the plug loads

Credit: Matthew Luckwitz/NREL

slide-10
SLIDE 10

Innovation for Our Energy Future Credit: Chad Lobato/NREL

October 2010 Plug Load Power Density

0.00 0.05 0.10 0.15 0.20 0.25 0.30 0.35 0.40 0.45 0.50 0.55 0.60 0.65 2 4 6 8 10 12 14 16 18 20 22 24 Power Density (W/ft2) Time of Day Model Weekday Plug Loads Model Weekend Plug Loads RSF Hourly Weekday Plug Loads RSF Average Weekday Plug Loads RSF Hourly Weekend Plug Loads RSF Average Weekend Plug Loads

slide-11
SLIDE 11

Innovation for Our Energy Future Credit: Chad Lobato/NREL

November 2010 Plug Load Power Density

0.00 0.05 0.10 0.15 0.20 0.25 0.30 0.35 0.40 0.45 0.50 0.55 0.60 0.65 2 4 6 8 10 12 14 16 18 20 22 24 Power Density (W/ft2) Time of Day Model Weekday Plug Loads Model Weekend Plug Loads RSF Hourly Weekday Plug Loads RSF Average Weekday Plug Loads RSF Hourly Weekend Plug Loads RSF Average Weekend Plug Loads

slide-12
SLIDE 12

Innovation for Our Energy Future Credit: Chad Lobato/NREL

December 2010 Plug Load Power Density

0.00 0.05 0.10 0.15 0.20 0.25 0.30 0.35 0.40 0.45 0.50 0.55 0.60 0.65 2 4 6 8 10 12 14 16 18 20 22 24 Power Density (W/ft2) Time of Day Model Weekday Plug Loads Model Weekend Plug Loads RSF Hourly Weekday Plug Loads RSF Average Weekday Plug Loads RSF Hourly Weekend Plug Loads RSF Average Weekend Plug Loads

slide-13
SLIDE 13

Innovation for Our Energy Future Credit: Chad Lobato/NREL

January 2011 Plug Load Power Density

0.00 0.05 0.10 0.15 0.20 0.25 0.30 0.35 0.40 0.45 0.50 0.55 0.60 0.65 2 4 6 8 10 12 14 16 18 20 22 24 Power Density (W/ft2) Time of Day Model Weekday Plug Loads Model Weekend Plug Loads RSF Hourly Weekday Plug Loads RSF Average Weekday Plug Loads RSF Hourly Weekend Plug Loads RSF Average Weekend Plug Loads

slide-14
SLIDE 14

Innovation for Our Energy Future Credit: Chad Lobato/NREL

February 2011 Plug Load Power Density

0.00 0.05 0.10 0.15 0.20 0.25 0.30 0.35 0.40 0.45 0.50 0.55 0.60 0.65 2 4 6 8 10 12 14 16 18 20 22 24 Power Density (W/ft2) Time of Day Model Weekday Plug Loads Model Weekend Plug Loads RSF Hourly Weekday Plug Loads RSF Average Weekday Plug Loads RSF Hourly Weekend Plug Loads RSF Average Weekend Plug Loads

slide-15
SLIDE 15

Innovation for Our Energy Future

March 2011 Plug Load Power Density

Credit: Chad Lobato/NREL 0.00 0.05 0.10 0.15 0.20 0.25 0.30 0.35 0.40 0.45 0.50 0.55 0.60 0.65 2 4 6 8 10 12 14 16 18 20 22 24 Power Density (W/ft2) Time of Day Model Weekday Plug Loads Model Weekend Plug Loads RSF Hourly Weekday Plug Loads RSF Average Weekday Plug Loads RSF Hourly Weekend Plug Loads RSF Average Weekend Plug Loads

slide-16
SLIDE 16

Innovation for Our Energy Future

April 2011 Plug Load Power Density

Credit: Chad Lobato/NREL 0.00 0.05 0.10 0.15 0.20 0.25 0.30 0.35 0.40 0.45 0.50 0.55 0.60 0.65 2 4 6 8 10 12 14 16 18 20 22 24 Power Density (W/ft2) Time of Day Model Weekday Plug Loads Model Weekend Plug Loads RSF Hourly Weekday Plug Loads RSF Average Weekday Plug Loads RSF Hourly Weekend Plug Loads RSF Average Weekend Plug Loads

slide-17
SLIDE 17

Innovation for Our Energy Future

May 2011 Plug Load Power Density

Credit: Chad Lobato/NREL 0.00 0.05 0.10 0.15 0.20 0.25 0.30 0.35 0.40 0.45 0.50 0.55 0.60 0.65 2 4 6 8 10 12 14 16 18 20 22 24 Power Density (W/ft2) Time of Day Model Weekday Plug Loads Model Weekend Plug Loads RSF Hourly Weekday Plug Loads RSF Average Weekday Plug Loads RSF Hourly Weekend Plug Loads RSF Average Weekend Plug Loads

slide-18
SLIDE 18

Innovation for Our Energy Future

June 2011 Plug Load Power Density

Credit: Chad Lobato/NREL 0.00 0.05 0.10 0.15 0.20 0.25 0.30 0.35 0.40 0.45 0.50 0.55 0.60 0.65 2 4 6 8 10 12 14 16 18 20 22 24 Power Density (W/ft2) Time of Day Model Weekday Plug Loads Model Weekend Plug Loads RSF Hourly Weekday Plug Loads RSF Average Weekday Plug Loads RSF Hourly Weekend Plug Loads RSF Average Weekend Plug Loads

slide-19
SLIDE 19

Innovation for Our Energy Future

July 2011 Plug Load Power Density

Credit: Chad Lobato/NREL 0.00 0.05 0.10 0.15 0.20 0.25 0.30 0.35 0.40 0.45 0.50 0.55 0.60 0.65 2 4 6 8 10 12 14 16 18 20 22 24 Power Density (W/ft2) Time of Day Model Weekday Plug Loads Model Weekend Plug Loads RSF Hourly Weekday Plug Loads RSF Average Weekday Plug Loads RSF Hourly Weekend Plug Loads RSF Average Weekend Plug Loads

slide-20
SLIDE 20

Innovation for Our Energy Future

August 2011 Plug Load Power Density

Credit: Chad Lobato/NREL 0.00 0.05 0.10 0.15 0.20 0.25 0.30 0.35 0.40 0.45 0.50 0.55 0.60 0.65 2 4 6 8 10 12 14 16 18 20 22 24 Power Density (W/ft2) Time of Day Model Weekday Plug Loads Model Weekend Plug Loads RSF Hourly Weekday Plug Loads RSF Average Weekday Plug Loads RSF Hourly Weekend Plug Loads RSF Average Weekend Plug Loads

slide-21
SLIDE 21

Innovation for Our Energy Future

September 2011 Plug Load Power Density

Credit: Chad Lobato/NREL 0.00 0.05 0.10 0.15 0.20 0.25 0.30 0.35 0.40 0.45 0.50 0.55 0.60 0.65 2 4 6 8 10 12 14 16 18 20 22 24 Power Density (W/ft2) Time of Day Model Weekday Plug Loads Model Weekend Plug Loads RSF Hourly Weekday Plug Loads RSF Average Weekday Plug Loads RSF Hourly Weekend Plug Loads RSF Average Weekend Plug Loads

slide-22
SLIDE 22

Innovation for Our Energy Future

October 2011 Plug Load Power Density

Credit: Chad Lobato/NREL 0.00 0.05 0.10 0.15 0.20 0.25 0.30 0.35 0.40 0.45 0.50 0.55 0.60 0.65 2 4 6 8 10 12 14 16 18 20 22 24 Power Density (W/ft2) Time of Day Model Weekday Plug Loads Model Weekend Plug Loads RSF Hourly Weekday Plug Loads RSF Average Weekday Plug Loads RSF Hourly Weekend Plug Loads RSF Average Weekend Plug Loads

slide-23
SLIDE 23

Innovation for Our Energy Future

November 2011 Plug Load Power Density

Credit: Chad Lobato/NREL 0.00 0.05 0.10 0.15 0.20 0.25 0.30 0.35 0.40 0.45 0.50 0.55 0.60 0.65 2 4 6 8 10 12 14 16 18 20 22 24 Power Density (W/ft2) Time of Day Model Weekday Plug Loads Model Weekend Plug Loads RSF Hourly Weekday Plug Loads RSF Average Weekday Plug Loads RSF Hourly Weekend Plug Loads RSF Average Weekend Plug Loads

slide-24
SLIDE 24

Innovation for Our Energy Future 24

  • 100% of the workstations

are daylit

  • No employee more than 30

feet from a window

NREL/PIX 17904

slide-25
SLIDE 25

Innovation for Our Energy Future 20 40 60 80 100 120 140 160 180 3 6 9 12 15 18 21 Power (kW) Time of Day ASHRAE 90.1 Baseline Lighting Power Installed Lighting Power Energy Model Lighting Power RSF Lighting Power

January 28, 2011 Lighting and Daylighting

January 28 was one of Colorado’s warm and sunny winter days.

Credit: Chad Lobato/NREL

slide-26
SLIDE 26

Innovation for Our Energy Future Credit: Chad Lobato/NREL

December 2010 – November 2011 Lighting Power Density

0.00 0.03 0.05 0.08 0.10 0.13 0.15 0.18 0.20 0.23 0.25 0.28 0.30 0.33 0.35 2 4 6 8 10 12 14 16 18 20 22 24 Power Density (W/ft2) Time of Day Model Average December 2010 January 2011 February 2011 March 2011 April 2011 May 2011 June 2011 July 2011 August 2011 September 2011 October 2011 November 2011

slide-27
SLIDE 27

Innovation for Our Energy Future

RSF Weekday Daylighting Performance

Credit: Chad Lobato/NREL 0.00 0.02 0.04 0.06 0.08 0.10 0.12 0.14 0.16 0.18 0.20 0.22 0.24 0.26 0.28 0.30 0.32 0.34 0.36 0.38 20 40 60 80 100 120 LPD (W/ft2) Solar Irradiance on a Vertical Surface (W/ft2) January February March April May June July August September October November

slide-28
SLIDE 28

Innovation for Our Energy Future Credit: Chad Lobato/NREL

October 2010 Lighting Power Density

0.00 0.03 0.05 0.08 0.10 0.13 0.15 0.18 0.20 0.23 0.25 0.28 0.30 0.33 0.35 2 4 6 8 10 12 14 16 18 20 22 24 Power Density (W/ft2) Time of Day Model Weekday Lighting Model Weekend Lighting RSF Hourly Weekday Lighting RSF Average Weekday Lighting RSF Hourly Weekend Lighting RSF Average Weekend Lighting

slide-29
SLIDE 29

Innovation for Our Energy Future Credit: Chad Lobato/NREL

November 2010 Lighting Power Density

0.00 0.03 0.05 0.08 0.10 0.13 0.15 0.18 0.20 0.23 0.25 0.28 0.30 0.33 0.35 2 4 6 8 10 12 14 16 18 20 22 24 Power Density (W/ft2) Time of Day Model Weekday Lighting Model Weekend Lighting RSF Hourly Weekday Lighting RSF Average Weekday Lighting RSF Hourly Weekend Lighting RSF Average Weekend Lighting

slide-30
SLIDE 30

Innovation for Our Energy Future Credit: Chad Lobato/NREL

December 2010 Lighting Power Density

0.00 0.03 0.05 0.08 0.10 0.13 0.15 0.18 0.20 0.23 0.25 0.28 0.30 0.33 0.35 2 4 6 8 10 12 14 16 18 20 22 24 Power Density (W/ft2) Time of Day Model Weekday Lighting Model Weekend Lighting RSF Hourly Weekday Lighting RSF Average Weekday Lighting RSF Hourly Weekend Lighting RSF Average Weekend Lighting

slide-31
SLIDE 31

Innovation for Our Energy Future Credit: Chad Lobato/NREL

January 2011 Lighting Power Density

0.00 0.03 0.05 0.08 0.10 0.13 0.15 0.18 0.20 0.23 0.25 0.28 0.30 0.33 0.35 2 4 6 8 10 12 14 16 18 20 22 24 Power Density (W/ft2) Time of Day Model Weekday Lighting Model Weekend Lighting RSF Hourly Weekday Lighting RSF Average Weekday Lighting RSF Hourly Weekend Lighting RSF Average Weekend Lighting

slide-32
SLIDE 32

Innovation for Our Energy Future Credit: Chad Lobato/NREL

February 2011 Lighting Power Density

0.00 0.03 0.05 0.08 0.10 0.13 0.15 0.18 0.20 0.23 0.25 0.28 0.30 0.33 0.35 2 4 6 8 10 12 14 16 18 20 22 24 Power Density (W/ft2) Time of Day Model Weekday Lighting Model Weekend Lighting RSF Hourly Weekday Lighting RSF Average Weekday Lighting RSF Hourly Weekend Lighting RSF Average Weekend Lighting

slide-33
SLIDE 33

Innovation for Our Energy Future

March 2011 Lighting Power Density

Credit: Chad Lobato/NREL 0.00 0.03 0.05 0.08 0.10 0.13 0.15 0.18 0.20 0.23 0.25 0.28 0.30 0.33 0.35 2 4 6 8 10 12 14 16 18 20 22 24 Power Density (W/ft2) Time of Day Model Weekday Lighting Model Weekend Lighting RSF Hourly Weekday Lighting RSF Average Weekday Lighting RSF Hourly Weekend Lighting RSF Average Weekend Lighting

slide-34
SLIDE 34

Innovation for Our Energy Future

April 2011 Lighting Power Density

Credit: Chad Lobato/NREL 0.00 0.03 0.05 0.08 0.10 0.13 0.15 0.18 0.20 0.23 0.25 0.28 0.30 0.33 0.35 2 4 6 8 10 12 14 16 18 20 22 24 Power Density (W/ft2) Time of Day Model Weekday Lighting Model Weekend Lighting RSF Hourly Weekday Lighting RSF Average Weekday Lighting RSF Hourly Weekend Lighting RSF Average Weekend Lighting

slide-35
SLIDE 35

Innovation for Our Energy Future

May 2011 Lighting Power Density

Credit: Chad Lobato/NREL 0.00 0.03 0.05 0.08 0.10 0.13 0.15 0.18 0.20 0.23 0.25 0.28 0.30 0.33 0.35 2 4 6 8 10 12 14 16 18 20 22 24 Power Density (W/ft2) Time of Day Model Weekday Lighting Model Weekend Lighting RSF Hourly Weekday Lighting RSF Average Weekday Lighting RSF Hourly Weekend Lighting RSF Average Weekend Lighting

slide-36
SLIDE 36

Innovation for Our Energy Future

June 2011 Lighting Power Density

Credit: Chad Lobato/NREL 0.00 0.03 0.05 0.08 0.10 0.13 0.15 0.18 0.20 0.23 0.25 0.28 0.30 0.33 0.35 2 4 6 8 10 12 14 16 18 20 22 24 Power Density (W/ft2) Time of Day Model Weekday Lighting Model Weekend Lighting RSF Hourly Weekday Lighting RSF Average Weekday Lighting RSF Hourly Weekend Lighting RSF Average Weekend Lighting

slide-37
SLIDE 37

Innovation for Our Energy Future

July 2011 Lighting Power Density

Credit: Chad Lobato/NREL 0.00 0.03 0.05 0.08 0.10 0.13 0.15 0.18 0.20 0.23 0.25 0.28 0.30 0.33 0.35 2 4 6 8 10 12 14 16 18 20 22 24 Power Density (W/ft2) Time of Day Model Weekday Lighting Model Weekend Lighting RSF Hourly Weekday Lighting RSF Average Weekday Lighting RSF Hourly Weekend Lighting RSF Average Weekend Lighting

slide-38
SLIDE 38

Innovation for Our Energy Future

August 2011 Lighting Power Density

Credit: Chad Lobato/NREL 0.00 0.03 0.05 0.08 0.10 0.13 0.15 0.18 0.20 0.23 0.25 0.28 0.30 0.33 0.35 2 4 6 8 10 12 14 16 18 20 22 24 Power Density (W/ft2) Time of Day Model Weekday Lighting Model Weekend Lighting RSF Hourly Weekday Lighting RSF Average Weekday Lighting RSF Hourly Weekend Lighting RSF Average Weekend Lighting

slide-39
SLIDE 39

Innovation for Our Energy Future

September 2011 Lighting Power Density

Credit: Chad Lobato/NREL 0.00 0.03 0.05 0.08 0.10 0.13 0.15 0.18 0.20 0.23 0.25 0.28 0.30 0.33 0.35 2 4 6 8 10 12 14 16 18 20 22 24 Power Density (W/ft2) Time of Day Model Weekday Lighting Model Weekend Lighting RSF Hourly Weekday Lighting RSF Average Weekday Lighting RSF Hourly Weekend Lighting RSF Average Weekend Lighting

slide-40
SLIDE 40

Innovation for Our Energy Future Credit: Chad Lobato/NREL 0.00 0.03 0.05 0.08 0.10 0.13 0.15 0.18 0.20 0.23 0.25 0.28 0.30 0.33 0.35 2 4 6 8 10 12 14 16 18 20 22 24 Power Density (W/ft2) Time of Day Model Weekday Lighting Model Weekend Lighting RSF Hourly Weekday Lighting RSF Average Weekday Lighting RSF Hourly Weekend Lighting RSF Average Weekend Lighting

October 2011 Lighting Power Density

slide-41
SLIDE 41

Innovation for Our Energy Future Credit: Chad Lobato/NREL

November 2011 Lighting Power Density

0.00 0.03 0.05 0.08 0.10 0.13 0.15 0.18 0.20 0.23 0.25 0.28 0.30 0.33 0.35 2 4 6 8 10 12 14 16 18 20 22 24 Power Density (W/ft2) Time of Day Model Weekday Lighting Model Weekend Lighting RSF Hourly Weekday Lighting RSF Average Weekday Lighting RSF Hourly Weekend Lighting RSF Average Weekend Lighting

slide-42
SLIDE 42

Innovation for Our Energy Future

Data Center PUE

Credit: Chad Lobato/NREL NREL/PIX 17828

  • 20
  • 5

10 25 40 55 70 85 100 0.70 0.80 0.90 1.00 1.10 1.20 1.30 1.40 1.50 10/1/10 11/30/10 1/29/11 3/30/11 5/29/11 7/28/11 9/26/11 11/25/11 Outdoor Temperature (°F) PUE RSF Data Center PUE Outdoor Temperature

slide-43
SLIDE 43

Innovation for Our Energy Future 0.00 0.03 0.05 0.08 0.10 0.13 0.15 0.18 0.20 0.23 0.25 2 4 6 8 10 12 14 16 18 20 22 24 Power Density (W/ft2) Time of Day Model Average October 2010 November 2010 December 2010 January 2011 February 2011 March 2011 April 2011 May 2011 June 2011 July 2011 August 2011 September 2011 October 2011 November 2011 Credit: Chad Lobato/NREL

October 2010 – November 2011 Mechanical System Power Density

Note: The mechanical load is comprised of only fans and pumps Note: Control of the VFDs was

  • ptimized in late October 2010,

resulting in energy savings Note: Control of the dampers was

  • ptimized in April 2011, resulting in

energy savings

slide-44
SLIDE 44

Innovation for Our Energy Future Credit: Chad Lobato/NREL

October 2010 Mechanical System Power Density

0.00 0.03 0.05 0.08 0.10 0.13 0.15 0.18 0.20 0.23 0.25 2 4 6 8 10 12 14 16 18 20 22 24 Power Density (W/ft2) Time of Day Model Weekday Mechanical System Model Weekend Mechanical System RSF Hourly Weekday Mechanical System RSF Average Weekday Mechanical System RSF Hourly Weekend Mechanical System RSF Average Weekend Mechanical System

slide-45
SLIDE 45

Innovation for Our Energy Future Credit: Chad Lobato/NREL

November 2010 Mechanical System Power Density

0.00 0.03 0.05 0.08 0.10 0.13 0.15 0.18 0.20 0.23 0.25 2 4 6 8 10 12 14 16 18 20 22 24 Power Density (W/ft2) Time of Day Model Weekday Mechanical System Model Weekend Mechanical System RSF Hourly Weekday Mechanical System RSF Average Weekday Mechanical System RSF Hourly Weekend Mechanical System RSF Average Weekend Mechanical System

slide-46
SLIDE 46

Innovation for Our Energy Future Credit: Chad Lobato/NREL

December 2010 Mechanical System Power Density

0.00 0.03 0.05 0.08 0.10 0.13 0.15 0.18 0.20 0.23 0.25 2 4 6 8 10 12 14 16 18 20 22 24 Power Density (W/ft2) Time of Day Model Weekday Mechanical System Model Weekend Mechanical System RSF Hourly Weekday Mechanical System RSF Average Weekday Mechanical System RSF Hourly Weekend Mechanical System RSF Average Weekend Mechanical System

slide-47
SLIDE 47

Innovation for Our Energy Future Credit: Chad Lobato/NREL

January 2011 Mechanical System Power Density

0.00 0.03 0.05 0.08 0.10 0.13 0.15 0.18 0.20 0.23 0.25 2 4 6 8 10 12 14 16 18 20 22 24 Power Density (W/ft2) Time of Day Model Weekday Mechanical System Model Weekend Mechanical System RSF Hourly Weekday Mechanical System RSF Average Weekday Mechanical System RSF Hourly Weekend Mechanical System RSF Average Weekend Mechanical System

slide-48
SLIDE 48

Innovation for Our Energy Future Credit: Chad Lobato/NREL

February 2011 Mechanical System Power Density

0.00 0.03 0.05 0.08 0.10 0.13 0.15 0.18 0.20 0.23 0.25 2 4 6 8 10 12 14 16 18 20 22 24 Power Density (W/ft2) Time of Day Model Weekday Mechanical System Model Weekend Mechanical System RSF Hourly Weekday Mechanical System RSF Average Weekday Mechanical System RSF Hourly Weekend Mechanical System RSF Average Weekend Mechanical System

slide-49
SLIDE 49

Innovation for Our Energy Future

March 2011 Mechanical System Power Density

Credit: Chad Lobato/NREL 0.00 0.03 0.05 0.08 0.10 0.13 0.15 0.18 0.20 0.23 0.25 2 4 6 8 10 12 14 16 18 20 22 24 Power Density (W/ft2) Time of Day Model Weekday Mechanical System Model Weekend Mechanical System RSF Hourly Weekday Mechanical System RSF Average Weekday Mechanical System RSF Hourly Weekend Mechanical System RSF Average Weekend Mechanical System

slide-50
SLIDE 50

Innovation for Our Energy Future

April 2011 Mechanical System Power Density

Credit: Chad Lobato/NREL 0.00 0.03 0.05 0.08 0.10 0.13 0.15 0.18 0.20 0.23 0.25 2 4 6 8 10 12 14 16 18 20 22 24 Power Density (W/ft2) Time of Day Model Weekday Mechanical System Model Weekend Mechanical System RSF Hourly Weekday Mechanical System RSF Average Weekday Mechanical System RSF Hourly Weekend Mechanical System RSF Average Weekend Mechanical System

slide-51
SLIDE 51

Innovation for Our Energy Future

May 2011 Mechanical System Power Density

Credit: Chad Lobato/NREL 0.00 0.03 0.05 0.08 0.10 0.13 0.15 0.18 0.20 0.23 0.25 2 4 6 8 10 12 14 16 18 20 22 24 Power Density (W/ft2) Time of Day Model Weekday Mechanical System Model Weekend Mechanical System RSF Hourly Weekday Mechanical System RSF Average Weekday Mechanical System RSF Hourly Weekend Mechanical System RSF Average Weekend Mechanical System

slide-52
SLIDE 52

Innovation for Our Energy Future

June 2011 Mechanical System Power Density

Credit: Chad Lobato/NREL 0.00 0.03 0.05 0.08 0.10 0.13 0.15 0.18 0.20 0.23 0.25 2 4 6 8 10 12 14 16 18 20 22 24 Power Density (W/ft2) Time of Day Model Weekday Mechanical System Model Weekend Mechanical System RSF Hourly Weekday Mechanical System RSF Average Weekday Mechanical System RSF Hourly Weekend Mechanical System RSF Average Weekend Mechanical System

slide-53
SLIDE 53

Innovation for Our Energy Future

July 2011 Mechanical System Power Density

Credit: Chad Lobato/NREL 0.00 0.03 0.05 0.08 0.10 0.13 0.15 0.18 0.20 0.23 0.25 2 4 6 8 10 12 14 16 18 20 22 24 Power Density (W/ft2) Time of Day Model Weekday Mechanical System Model Weekend Mechanical System RSF Hourly Weekday Mechanical System RSF Average Weekday Mechanical System RSF Hourly Weekend Mechanical System RSF Average Weekend Mechanical System

slide-54
SLIDE 54

Innovation for Our Energy Future

August 2011 Mechanical System Power Density

Credit: Chad Lobato/NREL 0.00 0.03 0.05 0.08 0.10 0.13 0.15 0.18 0.20 0.23 0.25 2 4 6 8 10 12 14 16 18 20 22 24 Power Density (W/ft2) Time of Day Model Weekday Mechanical System Model Weekend Mechanical System RSF Hourly Weekday Mechanical System RSF Average Weekday Mechanical System RSF Hourly Weekend Mechanical System RSF Average Weekend Mechanical System

slide-55
SLIDE 55

Innovation for Our Energy Future

September 2011 Mechanical System Power Density

Credit: Chad Lobato/NREL 0.00 0.03 0.05 0.08 0.10 0.13 0.15 0.18 0.20 0.23 0.25 2 4 6 8 10 12 14 16 18 20 22 24 Power Density (W/ft2) Time of Day Model Weekday Mechanical System Model Weekend Mechanical System RSF Hourly Weekday Mechanical System RSF Average Weekday Mechanical System RSF Hourly Weekend Mechanical System RSF Average Weekend Mechanical System

slide-56
SLIDE 56

Innovation for Our Energy Future

October 2011 Mechanical System Power Density

Credit: Chad Lobato/NREL 0.00 0.03 0.05 0.08 0.10 0.13 0.15 0.18 0.20 0.23 0.25 2 4 6 8 10 12 14 16 18 20 22 24 Power Density (W/ft2) Time of Day Model Weekday Mechanical System Model Weekend Mechanical System RSF Hourly Weekday Mechanical System RSF Average Weekday Mechanical System RSF Hourly Weekend Mechanical System RSF Average Weekend Mechanical System

slide-57
SLIDE 57

Innovation for Our Energy Future

November 2011 Mechanical System Power Density

Credit: Chad Lobato/NREL 0.00 0.03 0.05 0.08 0.10 0.13 0.15 0.18 0.20 0.23 0.25 2 4 6 8 10 12 14 16 18 20 22 24 Power Density (W/ft2) Time of Day Model Weekday Mechanical System Model Weekend Mechanical System RSF Hourly Weekday Mechanical System RSF Average Weekday Mechanical System RSF Hourly Weekend Mechanical System RSF Average Weekend Mechanical System

slide-58
SLIDE 58

Innovation for Our Energy Future

October 2010 – November 2011 Daily Heating Energy

Credit: Chad Lobato/NREL 1500 3000 4500 6000 7500 9000 10500 12000 13500 15000

  • 20

20 40 60 80 100 Daily Heating Energy (kWh) Average Daily Outdoor Temperature (°F) Model Daily Heating RSF Daily Heating Model Heating Trendline RSF Heating Trendline

slide-59
SLIDE 59

Innovation for Our Energy Future

2011 YTD Daily Cooling Energy

Credit: Chad Lobato/NREL 80 160 240 320 400 480 560 640 720 800

  • 20

20 40 60 80 100 Daily Cooling Energy (kWh) Average Daily Outdoor Temperature (°F) Model Daily Cooling RSF Total Daily Cooling

slide-60
SLIDE 60

Innovation for Our Energy Future

50000 100000 150000 200000 250000 300000 350000 Model RSF RSF PV Model RSF RSF PV Model RSF RSF PV Model RSF RSF PV Model RSF RSF PV Model RSF RSF PV Model RSF RSF PV Model RSF RSF PV Model RSF RSF PV Model RSF RSF PV Model RSF RSF PV Model RSF RSF PV Model RSF RSF PV Model RSF RSF PV Oct 2010 Nov 2010 Dec 2010 Jan 2011 Feb 2011 Mar 2011 Apr 2011 May 2011 Jun 2011 Jul 2011 Aug 2011 Sep 2011 Oct 2011 Nov 2011

Monthly Energy (kWh) PV Data Center Mechanical Systems Plug Loads Lighting Heating Cooling

Measured Versus Modeled Monthly End Use Energy Consumption

60 Credit: Chad Lobato/NREL

Note: July 2011 was the first net zero energy month

slide-61
SLIDE 61

Innovation for Our Energy Future 100 200 300 400 500 600 700 800 900 2 4 6 8 10 12 14 16 18 20 22 24 Power (kW) Time of Day Model Average 449kW Model Average 973kW December 2010 January 2011 February 2011 March 2011 April 2011 May 2011 June 2011 July 2011 August 2011 September 2011 October 2011 November 2011 Credit: Chad Lobato/NREL

December 2010 – November 2011 PV System Power Output

61 Note: 1156 kW Parking Garage PV system yet to be installed.

Testing and commissioning of the 524 kW Visitors Parking Lot PV system

  • ccurred in June. The system became

fully operational in July, giving a total system size of 973 kW.

slide-62
SLIDE 62

Innovation for Our Energy Future Credit: Chad Lobato/NREL

December 2010, RSF Roof-Mounted PV Power Output

62 50 100 150 200 250 300 350 400 450 2 4 6 8 10 12 14 16 18 20 22 24 Power (kW) Time of Day Model Average PV Output RSF Hourly PV Output RSF Average PV Output

slide-63
SLIDE 63

Innovation for Our Energy Future Credit: Chad Lobato/NREL

January 2011, RSF Roof-Mounted PV Power Output

63 50 100 150 200 250 300 350 400 450 2 4 6 8 10 12 14 16 18 20 22 24 Power (kW) Time of Day Model Average PV Output RSF Hourly PV Output RSF Average PV Output

slide-64
SLIDE 64

Innovation for Our Energy Future Credit: Chad Lobato/NREL

February 2011, RSF Roof-Mounted PV Power Output

64 50 100 150 200 250 300 350 400 450 2 4 6 8 10 12 14 16 18 20 22 24 Power (kW) Time of Day Model Average PV Output RSF Hourly PV Output RSF Average PV Output

slide-65
SLIDE 65

Innovation for Our Energy Future

March 2011, RSF Roof-Mounted PV Power Output

65 Credit: Chad Lobato/NREL 50 100 150 200 250 300 350 400 450 2 4 6 8 10 12 14 16 18 20 22 24 Power (kW) Time of Day Model Average PV Output RSF Hourly PV Output RSF Average PV Output

slide-66
SLIDE 66

Innovation for Our Energy Future

April 2011, RSF Roof-Mounted PV Power Output

66 Credit: Chad Lobato/NREL 50 100 150 200 250 300 350 400 450 2 4 6 8 10 12 14 16 18 20 22 24 Power (kW) Time of Day Model Average PV Output RSF Hourly PV Output RSF Average PV Output

slide-67
SLIDE 67

Innovation for Our Energy Future

May 2011, RSF Roof-Mounted PV Power Output

67 Credit: Chad Lobato/NREL 50 100 150 200 250 300 350 400 450 2 4 6 8 10 12 14 16 18 20 22 24 Power (kW) Time of Day Model Average PV Output RSF Hourly PV Output RSF Average PV Output

slide-68
SLIDE 68

Innovation for Our Energy Future

June 2011, RSF Roof-Mounted PV Power Output

68 Credit: Chad Lobato/NREL 100 200 300 400 500 600 700 800 900 2 4 6 8 10 12 14 16 18 20 22 24 Power (kW) Time of Day Model Average PV Output RSF Hourly PV Output RSF Average PV Output

Testing and commissioning of the 524 kW Visitors Parking Lot PV system

  • ccurred in June. The system will be

fully operational in July, giving a total system size of 973 kW.

slide-69
SLIDE 69

Innovation for Our Energy Future Credit: Chad Lobato/NREL 100 200 300 400 500 600 700 800 900 2 4 6 8 10 12 14 16 18 20 22 24 Power (kW) Time of Day Model Average PV Output RSF Hourly PV Output RSF Average PV Output

July 2011, RSF Roof and Site Mounted PV Power Output

69

Testing and commissioning of the 524 kW Visitors Parking Lot PV system

  • ccurred in June. The system will be

fully operational in July, giving a total system size of 973 kW.

slide-70
SLIDE 70

Innovation for Our Energy Future

August 2011, RSF Roof and Site Mounted PV Power Output

70 Credit: Chad Lobato/NREL 100 200 300 400 500 600 700 800 900 2 4 6 8 10 12 14 16 18 20 22 24 Power (kW) Time of Day Model Average PV Output RSF Hourly PV Output RSF Average PV Output

slide-71
SLIDE 71

Innovation for Our Energy Future

September 2011, RSF Roof and Site Mounted PV Power Output

71 Credit: Chad Lobato/NREL 100 200 300 400 500 600 700 800 900 2 4 6 8 10 12 14 16 18 20 22 24 Power (kW) Time of Day Model Average PV Output RSF Hourly PV Output RSF Average PV Output

slide-72
SLIDE 72

Innovation for Our Energy Future

October 2011, RSF Roof and Site Mounted PV Power Output

72 Credit: Chad Lobato/NREL 100 200 300 400 500 600 700 800 900 2 4 6 8 10 12 14 16 18 20 22 24 Power (kW) Time of Day Model Average PV Output RSF Hourly PV Output RSF Average PV Output

slide-73
SLIDE 73

Innovation for Our Energy Future

November 2011, RSF Roof and Site Mounted PV Power Output

73 Credit: Chad Lobato/NREL 100 200 300 400 500 600 700 800 900 2 4 6 8 10 12 14 16 18 20 22 24 Power (kW) Time of Day Model Average PV Output RSF Hourly PV Output RSF Average PV Output

slide-74
SLIDE 74

Innovation for Our Energy Future

First day of Net zero – June 23, 2011

74

slide-75
SLIDE 75

Innovation for Our Energy Future

  • 700
  • 600
  • 500
  • 400
  • 300
  • 200
  • 100

100 200 12:00 AM 3:00 AM 6:00 AM 9:00 AM 12:00 PM 3:00 PM 6:00 PM 9:00 PM 12:00 AM Power (kW) 75

Hitting Zero!

Credit: Chad Lobato/NREL

First day of Net zero – June 23, 2011

NREL/PIX 17848 Note: The 524kW Visitor Parking Lot PV system was only

  • perational from 9:30am to

2:30pm NREL/PIX 18828

slide-76
SLIDE 76

Innovation for Our Energy Future

  • 700
  • 600
  • 500
  • 400
  • 300
  • 200
  • 100

100 200 12:00 AM 3:00 AM 6:00 AM 9:00 AM 12:00 PM 3:00 PM 6:00 PM 9:00 PM 12:00 AM Power (kW) 76

Hitting Zero!

Credit: Chad Lobato/NREL

973-kW Roof and Site Mounted PV Installed and Operational July 2011

NREL/PIX 17848 Note: The 449kW RSF I Roof PV system and 524kW Visitor Parking Lot PV system both fully operational NREL/PIX 18828

slide-77
SLIDE 77

Innovation for Our Energy Future Innovation for Our Energy Future

RSF is a living laboratory and researchers use real- time building performance data to study building energy use.

77

NREL/PIX 17408