SLIDE 1 Thomas Preibisch, Stefan Kraus, Keiichi Ohnaka
Max Planck Institute for Radio Astronomy, Bonn
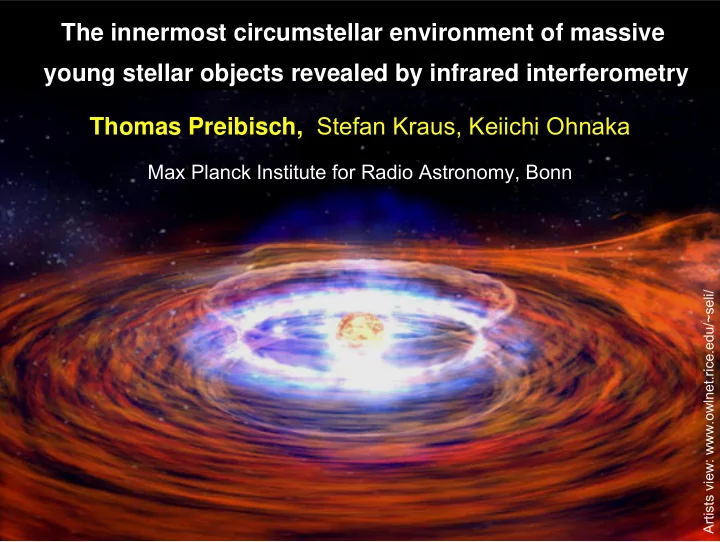
The innermost circumstellar environment of massive young stellar objects revealed by infrared interferometry
Artists view: www.owlnet.rice.edu/~seli/
SLIDE 2 Spatial resolution at D = 500 pc:
- HST, Adaptive Optics, Speckle:
mirror Ø ≤ 8 m
NIR resolution ~ 0.05 arcsec = 25 AU
- Long-Baseline Interferometry:
B ≤ 200 m
NIR resolution ~ 2 mas = 1 AU
Dusty disk Dusty disk
Dust sublimation radius
solar-mass star: Rsub ~ 0.1 AU, 18 M star: Rsub ~ 10 AU ~ 270 R
Tdust = 1500 K
The inner circumstellar regions of young stellar objects
100 AU 5 AU
SLIDE 3
Optical Path Difference
OPD compensation
Concept of the ESO Very Large Telescope Interferometer
Long Baseline Interferometry
SLIDE 4 Visibility := contrast of the fringe system
100% contrast Visibility = 1 unresolved
high Visibility marg. resolved
low contrast
0% contrast Visibility = 0 over-resolved
Ø << λ/B Ø < λ/B Ø ~ λ/B Ø >> λ/B
high contrast low Visibility resolved
SLIDE 5
Visibility as function of object size and baseline length
Gauss models FWHM = 5, 10, 20 mas V = 0.42 @ B = 100 m Gauss Ø = 10 mas
SLIDE 6
1.) Interferometric NIR size estimates
adapted from Monier & Millan-Gabet 2002
Sublimation radius Rsubl ∝ L ½ Near-infrared emission comes (mainly) from hot dust near the inner edge of the dusty disk at the dust sublimation radius
SLIDE 7
MIDI: N-band (8−13 μm) R= λ/Δλ = 30, 230 AMBER: J, H, K-band (1−2.5 μm) R = 30, 1500, 12000
Near- + mid-infrared spectro - interferometry with MIDI + AMBER at the ESO VLTI
SLIDE 8 Near-Infrared: 2 μm Mid-Infrared: 10 μm
Near- and mid-infrared emission probe different regions: Combination of near- & mid-infrared spectro-interferometry can probe the detailed physical conditions in the disk, e.g. radial temperature profile, dust chemistry/grain size distribution, …
- NIR: usually dominated by
hot (1500 - 1000 K) dust at inner disk edge + scattered stellar light
hot & warm dust (1500 - 300 K)
SLIDE 9
MWC 147 = HD259431
Hillenbrand et al (1992): SpT = B2, M = 12 M Hernandez et al (2004):
SpT = B6, M = 7 M L=1,550 L; Teff=14,000 K; Age ~0.3 Myr Monoceros OB1 (D=800 pc)
SLIDE 10 SED modeling: estimated accretion rate Ṁacc = 1.0×10⁻⁵ M/yr
(Hillenbrand et al. 1992)
MWC 147
- reflection nebulosity
- extended mid-infrared emission (6 arcsec)
- strong infrared excess
SLIDE 11
VLTI / MIDI: 7 observations 8 − 13 μm, R = 30 Vis = 0.5 ... 0.9 VLTI / AMBER: 1 observation 2.0 − 2.4 μm, R = 35 Vis = 0.75 PTI (archive): 5 observations broadband K Vis = 0.8
Interferometric observations of MWC 147
SLIDE 12
source seems to be elongated flattened structure (disk) Characteristic size at different position angles
SLIDE 13 adapted from Millan-Gabet et al., PPV review RNIR, Ring Radius [AU] Luminosity [Lʘ]
Sublimation radius Rsubl ∝ L 1/2
MWC 147
Characteristic near-infrared size (ring model radius) of MWC 147:
0.7 AU
Expected dust sublimation radius:
2.5 AU
SLIDE 14
i = 30o
Model visbilities Model images
i = 90o
2.) Interferometric observations at different wavelengths and baselines Parametric imaging
Comparison of predicted and observed visibilities
( + SED)
Constraints on model parameters
SLIDE 15 1: Spherical shell model 2: Disk model
Spherical Shell Flared Keplerian Disk
Inclination: 45º
Model image 2.25 μm Moldel image 2.25 μm
SED fits are highly ambiguous! SED fits are highly ambiguous!
15 AU = 12 mas
Z r r Z
density density
SLIDE 16 χr
2 = 80
χr
2 = 42
NIR visibilities MIR visibilities
1: Spherical shell model 2: Disk model
SLIDE 17 NIR visibilities MIR visibilities
NIR model visibilities are much smaller than the observed visibilities emission is more compact than assumed in the models
1: Spherical shell model 2: Disk model χr
2 = 80
χr
2 = 42
SLIDE 18 We model the gas in the inner accretion disk to be
- geometrically thin
- extend from Rcorot (~ 3 R) to Rsubl (~2.5 AU)
- follow the temperature-profile
from Pringle (1981) Solution:
Emission from Emission from gas in the inner disk gas in the inner disk
Muzerolle et al. 2004:
Emission from gas in the inner accretion disk can dominate near-infrared emission for accretion rates ≥ 10-6 M / yr
Gas Dust+Gas
K-band model image
SLIDE 19 SED MIR visibilities Inclination: 60º, Ṁacc
acc = 9
= 9× ×10 10-
6 M
Mʘ
ʘ/yr
/yr NIR visibilities
3: 3: Flared dusty disk + inner gas disk: χr
2 = 1.28
SLIDE 20 Best Best-
- fit radiative transfer model images
fit radiative transfer model images
1.65 μm 2.41 μm 8 μm 10 μm 12 μm 2.02 μm
15 AU = 12 mas log (Intensity)
NIR emission comes mainly from inner gas disk MIR emission comes also from warm dust in the disk
SLIDE 21 weak gas emission strong gas emission
NIR emission of massive young stars often dominated by gas emission
(see also Monnier et al. 2005, Eisner et al. 2005, Vinkovic & Jurkic 2007)
NIR emission from dust disk NIR emission from inner gas disk
Muzerolle et al. 2004 gas dust gas dust
adapted from Millan-Gabet et al., PPV
SLIDE 22
spectro-interferometric observations over a wide wavelength range radiation transfer modeling can provide unique constraints on the geometry/physics of the inner circumstellar environment of young stellar objects
- MWC 147:
- resolved at near- and mid-infrared wavelengths
- brightness distribution is asymmetric flattened structure (disk)
- size of NIR emission is smaller than expected dust sublimation radius
- model of a dust disk + emission from an inner gas disk
can simultaneously reproduce SED, near- and mid-infrared visibilities
(Kraus, Preibisch, Ohnaka, submitted to ApJ)
- NIR contribution of inner gas disk seems to increase with stellar mass
Summary
+
SLIDE 23 The (near) future: Interferometric imaging
combine 3 (or more) telescopes (closure phase) reconstruction of images with mas resolution Example: image reconstruction with simulated VLTI / AMBER data: 4 nights with 3 ATs
K-band, S/N = 50
u,v plane coverage
model image folded image reconstructed image
simulation by K.-H. Hofmann and S. Kraus, MPIfR Bonn 3 mas
i = 45o