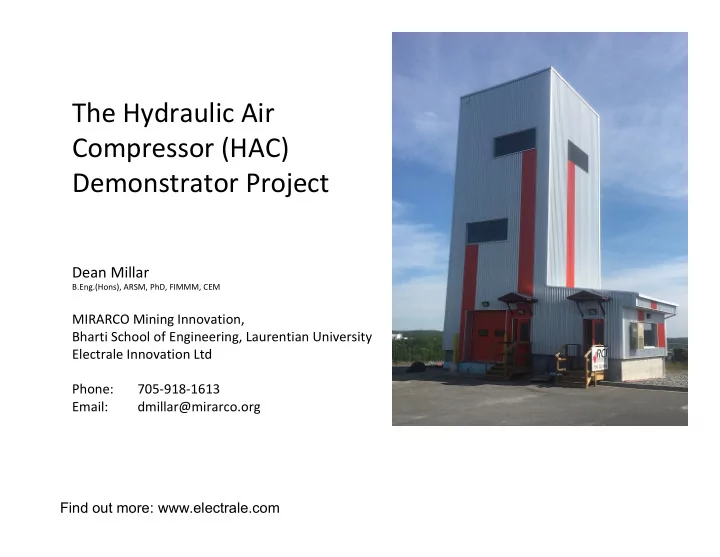

The Hydraulic Air Compressor (HAC) Demonstrator Project Dean Millar B.Eng.(Hons), ARSM, PhD, FIMMM, CEM MIRARCO Mining Innovation, Bharti School of Engineering, Laurentian University Electrale Innovation Ltd Phone: 705-918-1613 Email: dmillar@mirarco.org Find out more: www.electrale.com
Q. What will be demonstrated? A. Isothermal compressors that are easy to maintain will be cheaper to run 12% 12% Equipment and installation Maintenance Electricity 76% Shaded area = (Minimum) compression work US DOE: OFFICE OF INDUSTRIAL TECHNOLOGIES* https://www.energystar.gov/ia/business/industry/compressed_air1.pdf *50 kW e motor on the compressor, 2 shifts per day, 5 days per week, $0.05/kWh, 10 years
Modelled and measured processes are both nearly isothermal 12 12 10 10 Temperature increase in downcomer (mK) Temperature increase in downcomer (mK) 8 8 6 6 dT - BM38A � t 4 4 � � � dT - Pavese at al. dT - BM36A 2 2 dT - Pavese at al. 0 0 0.1 0.1 0.15 0.15 0.2 0.2 0.25 0.25 0.3 0.3 0.35 0.35 0.4 0.4 0.45 0.45 0.5 0.5 Water discharge (m3/s) Water discharge (m3/s)
Optimum compresion efficiencies are around 75 to 80% 300 300 80 80 75 75 275 275 70 70 250 250 65 65 225 225 60 60 55 55 200 200 Free Air Delivery (Scfm) Free Air Delivery (Scfm) 50 50 Efficiency (%) Efficiency (%) 175 175 45 45 150 150 40 40 35 35 125 125 30 30 100 100 25 25 BM36A & BM38A FAD 75 75 20 20 HAC Mk 14 FAD 15 15 50 50 10 10 BM36A & BM38A Eff (%) 25 25 5 5 HAC Mk 14 Eff (%) 0 0 0 0 0.1 0.1 0.15 0.15 0.2 0.2 0.25 0.25 0.3 0.3 0.35 0.35 0.4 0.4 0.45 0.45 0.5 0.5 Water discharge (m3/s) Water discharge (m3/s)
As we explore the performance map of Dynamic Earth HAC we expect to obtain even better performance 100 Ragged Chutes Input mass flow rate of air (kg/s)) 10 1 0.1 Dynamic Earth 0.01 0.001 0.01 0.1 1 10 QH/D
We are thinking about HAC designs for mine installation Integrated cooling No mixing head Sump in half of drift Raise forms riser Co-axial downcomer Open ended separator All instruments at base Simple PID loop
Detrainment occurs at low water flow rates 9
~95% of the spend on the HAC Demonstrator was spent in Northern Ontario / Sudbury
The HAC Pack Find out more: www.electrale.com 705-918-1613 dmillar@mirarco.org 9
The rubber lined pipe appears rougher than steel pipe Literature value: 0.000150 m Our value: 0.000058 m Unlined steel pipe (low): 0.000045 m Unlined steel pipe (high): 0.000090 m 9
Zero pressure in the downcomer means water ‘free-fall’ 3.00 600 rpm 650 rpm 700 rpm 750 rpm 800 rpm 850 880 rpm Pressure (mH2O) 2.00 1.00 0.27m 0.15m -0.03m -0.02m -0.07m - 0.20m 0.00 0 200 400 600 800 1000 1200 1400 1600 -1.00 P1P1 (@0.72 m below forebay base) Time (s) 3.00 Pressure (mH2O) 2.00 0.98m 0.50m 0.39m 0.21m -0.11m -0.07m -0.13m 1.00 0.00 0 200 400 600 800 1000 1200 1400 1600 -1.00 Time (s) P1P2 (@1.50m below forebay 3.00 1.62m 1.35m 1.24m 1.15m 0.97m 1.01m 0.90m Pressure (mH2O) 2.00 1.00 0.00 0 200 400 600 800 1000 1200 1400 1600 -1.00 Time (s) P2P2 (@2.25m below forebay 3.00 2.23m 2.00m 1.87m 1.80m 1.59m 1.64m 1.47 Pressure (mH2O) 2.00 1.00 0.00 0 200 400 600 800 1000 1200 1400 1600 -1.00 P2P1 (@3.00m below forebay Time (s) 9
Zero pressure in the downcomer means water ‘free-fall’ 3.00 600 rpm 650 rpm 700 rpm 750 rpm 800 rpm 850 880 rpm Pressure (mH2O) 2.00 1.00 0.27m 0.15m -0.03m -0.02m -0.07m - 0.20m 0.00 0 200 400 600 800 1000 1200 1400 1600 -1.00 P1P1 (@0.72 m below forebay base) Time (s) 3.00 Pressure (mH2O) 2.00 0.98m 0.50m 0.39m 0.21m -0.11m -0.07m -0.13m 1.00 0.00 0 200 400 600 800 1000 1200 1400 1600 -1.00 Time (s) P1P2 (@1.50m below forebay 3.00 1.62m 1.35m 1.24m 1.15m 0.97m 1.01m 0.90m Pressure (mH2O) 2.00 1.00 0.00 0 200 400 600 800 1000 1200 1400 1600 -1.00 Time (s) P2P2 (@2.25m below forebay 3.00 2.23m 2.00m 1.87m 1.80m 1.59m 1.64m 1.47 Pressure (mH2O) 2.00 1.00 0.00 0 200 400 600 800 1000 1200 1400 1600 -1.00 P2P1 (@3.00m below forebay Time (s) 9
Detrainment occurs at low water flow rates 9
Recommend
More recommend