the global commission on the economy and climate
play

THE GLOBAL COMMISSION ON THE ECONOMY AND CLIMATE Manish Bapna - PDF document

THE GLOBAL COMMISSION ON THE ECONOMY AND CLIMATE Manish Bapna (mbapna@wri.org ) Executive Vice President, World Resources Institute 22 January 2015 www.newclimateeconomy.net 0 0 Better Growth, Better Climate; The New Climate Economy Report


  1. THE GLOBAL COMMISSION ON THE ECONOMY AND CLIMATE Manish Bapna (mbapna@wri.org ) Executive Vice President, World Resources Institute 22 January 2015 www.newclimateeconomy.net 0 0 
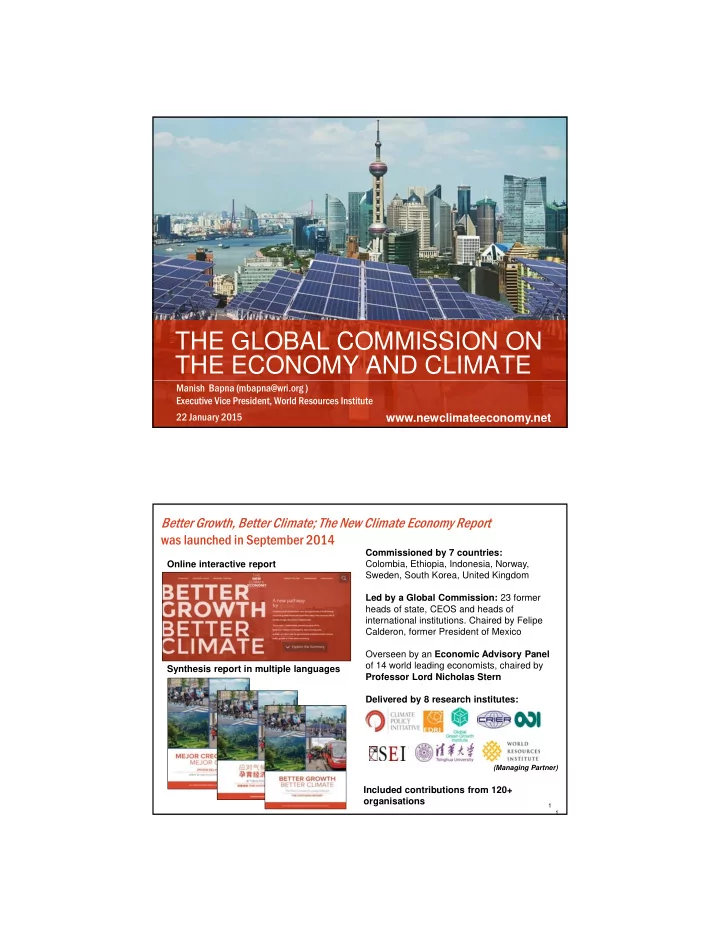
Better Growth, Better Climate; The New Climate Economy Report was launched in September 2014 Commissioned by 7 countries: Colombia, Ethiopia, Indonesia, Norway, Online interactive report Sweden, South Korea, United Kingdom Led by a Global Commission: 23 former heads of state, CEOS and heads of international institutions. Chaired by Felipe Calderon, former President of Mexico Overseen by an Economic Advisory Panel of 14 world leading economists, chaired by Synthesis report in multiple languages Professor Lord Nicholas Stern Delivered by 8 research institutes: (Managing Partner) Included contributions from 120+ organisations 1 1

  2. Members of the Global Commission on Economy and Climate Fe Felip lipe C e Cald lder erón (Chair ir) Former President of Mexico Ca Caio Koch ch W Weser Vice Chairman Deutche Bank Ing Ingrid id Bonde Bonde CFO and Deputy CEO of Vattenfall Ri Ricardo La Lago gos Former President of Chile SharanBurrow Sharan Burrow General Secretary of the International Trade Mich Mi chel Li Liès ès CEO of Swiss Re Union Confederation Trev evor or M Manuel anuel Planning Minister and former Finance Ch Chen Yu Yuan Governor of the China Minister of South Africa Development Bank Take kehik hiko Nakao kao President of the Asian Development Helen C He len Clark ark Administrator of the UNDP and former Prime Bank Minister of New Zealand Luísa ísa Diog iogo(Vic ice-C e-Chai hair) Former Prime Minister of Mozambique Annise Parker Annise Parker Mayor of Houston Paul Polman Paul Polman CEO of Unilever Dan D an Doctor oroff off Former CEO of Bloomberg Nemat (Mino nouch uche) Shaf ) Shafik ik Deputy Governor Bank of England S. (Kris S. ( ris) G Gopalakr palakrishn hnan an Executive Vice-Chairman of Infosys and President of the Confederation of Indian Industry Nichola holas Ste Stern ( n (Vic ice-C e-Chair) Professor at the London School of Economics and Political Science Angel Gurría Angel Gurría Secretary General of the OECD Chad had Hollid Holliday Chairman of Shell Jens Stolt Je ns Stoltenber erg Former Prime Minister of Norway Sri Mulyani Sri M lyani Indr Indrawat awati Managing Director and COO of the World Bank Zhu L Zhu Levin CEO of the China International Capital and former Finance Minister of Indonesia Corporation Eduard Eduardo Pae Paes Mayor Rio de Janeiro Maria van ria van de der Hoe Hoeven en Executive Director, International Energy Agency 2 Main findings of the Commission: • Economic growth and climate mitigation can be achieved together. We do not need to choose. • A growing number of businesses, cities and countries are demonstrating this. Recent technological and policy developments mean that even more opportunities are available today. • About US$ 90 trillion will be invested in infrastructure to 2030 – need to choose if it is low-carbon and climate resilient. Low-carbon would not cost much more, and fuel savings could fully offset additional investment costs. • But if we lock-in the wrong path, we risk significant economic and social impacts of climate change. Need to act urgently. • There are multiple economic benefits of action, e.g. reduced health costs from air pollution, less congestion & road deaths, enhanced energy, water and food security. In many cases these will outweigh the costs of action – and can get us 50-90% of the abatement by 2030 for a 2C path. 3

  3. Key drivers of growth and climate performance LAND CITIES ENERGY USE RESOURCE EFFICIENCY WIDER ECONOMY INFRASTRUCTURE INVESTMENT INNOVATION HIGH QUALITY, RESILIENT, INCLUSIVE = BETTER GROWTH 4 CITIES: Atlanta and Barcelona have similar populations and wealth levels but very different carbon productivities ATLANTA BARCELONA Atlanta’s built-up area Barcelona’s built-up area Population: 5.26 million Population: 5 million Total area: 3263 km 2 Total area: 16,605 km 2 Urban area: 648 km 2 Urban area: 7692 km 2 Transport carbon emissions: 6.9 tonnes Transport carbon emissions: 1.2 CO 2 p.c. tonnes CO 2 p.c. Source: LSE research, drawing on data from Atlanta Regional Commission (2014), Autoritat del Transport Metropolita (Area de Barcelona) (2013), GenCat 5 (2013), UCSB (2014), D’Onofrio (2014), based on latest data.

  4. Bus rapid transit systems can carry up to 2 million passengers a day at less than 15% of the costs of a metro; travel times reduced 32% Bogota, Colombia Sources: Cityfix.com, NY Times, LSE and NCE Cities – Paper 03 Accessibility in Cities: Transport and Urban Form, p 10-11 6 LAND USE: Over 300 million ha of degraded land could be restored in Sub-Saharan Africa; the Niger case highlights the possibility 1980s 1980s Present Day • Significantly improved agricultural productivity on 5 million HA and restored others • Farmers produce at least 100 kg/ha more now than before • More than doubled farm income for over a million households 7

  5. Energy: Low-carbon solutions improve in performance Illustrative when considered against a richer set of decision criteria Coal Gas* RES EE Nuclear Affordable 1990 Affordable 2014 Secure Accessible Scalable Local impacts Low-carbon Stable * Gas as substitute in current coal-rich countries 8 ENERGY: The cost of solar PV is dropping fast USD/MWh Solar PV, historical Current fossil fuel range, indicative Best utility-scale project, 2014 1990 1995 2000 2005 2010 2014 Sources: Citi Research 2012; G. F Nemet, “Beyond the learning curve”, Energy Policy 34, 3218-3232 (2006) 9

  6. ENERGY: Wind and solar power have become cost-competitive in several markets, even without subsidies Rooftop solar cheaper than Wind also reported competitive with coal in Australia , Chile , Mexico , electricity retail rates in at least 11 countries New Zealand , Turkey . U.S. Wind at 5-8 ¢/kWh, cheaper than new U.S. coal southwest: Solar plant at Parts of India: ~8 ¢/kWh, Wind at 6-10 ¢/kWh, competitive close to coal at 5-8 with coal ¢/kWh Chile: First solar plant South Africa: Brazil: with no govt. 7 ¢/kWh wind, 4.5 ¢/kWh wind, support 30% cheaper than cheaper than new coal any other source Source: REN21 Renewables 2014 Global Status Report; Deutsche Bank Markets Research; IEA 2013 Wind Roadmap. 10 ENERGY: Renewable energy investments – by selected country/region 2004- 2013 Source: BNEF/UNEP, 2014, Global trends in renewable energy investment 2014. Note: ASOC is Asia and Oceania. 11

  7. POLICIES: There are significant subsidies to the high-carbon economy Sources: OECD (2013), Inventory of Estimated Budgetary Support and Tax Expenditures for Fossil Fuels; IEA (2013), World Energy Outlook; IEA (2013), OECD (2014, forthcoming) 12 POLICIES: Global growth of carbon pricing SOURCE: This map was taken from the State and Trends of Carbon Pricing report 2014, developed by the World Bank and Ecofys, and published in May 2014. 13

  8. INVESTMENT: Infrastructure capital spend is estimated to be marginally higher in a low-carbon scenario Source: OECD (2006, 2012), IEA ETP (2012), modelling by Climate Policy Initiative (CPI) for New Climate Economy, and New Climate Economy analysis. 14 INNOVATION: Energy R&D as a percent of GDP has been falling in most developed countries since the 1980s Energy R&D as % of GDP in IEA member countries 1 Energy R&D split in 2011 4% 0.12% 5% 11% 0.10% 27% 0.08% 14% 0.06% 21% 17% 0.04% Nuclear 0.02% Renewable energy Energy efficiency Other cross cutting technologies/research 0.00% 1974 1980 1985 1990 1995 2000 2005 2011 Fossil fuels Other power and storage technologies Hydrogen and fuel cells Source: R&D figures and split from International Energy Agency (2013), Tracking Clean Energy Progress 2013, OECD/IEA, Paris, GDP figures from World Development Indicators 2014, adjusted for inflation from 2005 to 2010 15

  9. The Global Commission recommends 10 transformative actions Next steps Integrate climate risk into strategic decisions 1 2 Secure a strong international climate agreement 3 End perverse subsidies 4 Price carbon to send a clear market signal Scale-up low-carbon innovation 5 Reduce the cost of capital for low-carbon investment 6 7 Move toward connected and compact cities 8 End deforestation 9 Restore degraded lands 10 10 Phase out unabated coal fast Source: NCE. For details please see the NCE Global Action Plan (2014) 16 Actions with economic benefits could deliver most of the greenhouse gas abatement needed by 2030 Source: Emissions estimates: IPCC AR5; New Climate Economy analysis based on expert input and multiple data sources 17

Download Presentation
Download Policy: The content available on the website is offered to you 'AS IS' for your personal information and use only. It cannot be commercialized, licensed, or distributed on other websites without prior consent from the author. To download a presentation, simply click this link. If you encounter any difficulties during the download process, it's possible that the publisher has removed the file from their server.

Recommend


More recommend