
SLIDE 1
PAGE 1 CREATING VALUE
ING OFFICE FUND Acquisition of Waltham Woods Corporate Center (50%) - - PowerPoint PPT Presentation
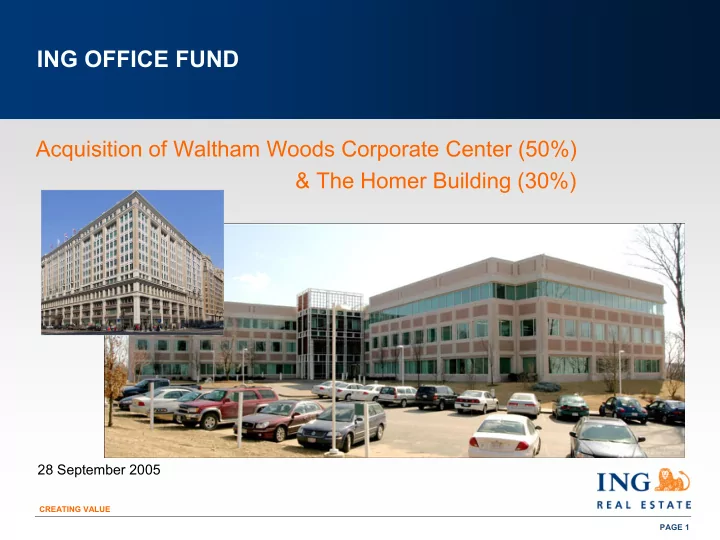
ING OFFICE FUND Acquisition of Waltham Woods Corporate Center (50%) & The Homer Building (30%) 28 September 2005 CREATING VALUE PAGE 1 PRESENTATION Speakers Valentino Tanfara, CEO ING Office Fund Craig Tagen, US Portfolio
PAGE 1 CREATING VALUE
PAGE 2 CREATING VALUE
PAGE 3 CREATING VALUE
PAGE 4 CREATING VALUE
PAGE 5 CREATING VALUE
PAGE 6 CREATING VALUE
PAGE 7 CREATING VALUE
PAGE 8 CREATING VALUE
PAGE 9 CREATING VALUE
PAGE 10 CREATING VALUE
PAGE 11 CREATING VALUE
PAGE 12 CREATING VALUE
PAGE 13 CREATING VALUE
PAGE 14 CREATING VALUE
PAGE 15 CREATING VALUE
PAGE 16 CREATING VALUE
PAGE 17 CREATING VALUE
PAGE 18 CREATING VALUE
PAGE 19 CREATING VALUE
PAGE 20 CREATING VALUE
0% 5% 10% 15% 20% 25% 30% 1 9 9 1 9 9 2 1 9 9 4 1 9 9 6 1 9 9 8 2 2 2 2 4 2 6 2 8
PAGE 21 CREATING VALUE
5 10 15 20 25 30 35 40 1 9 9 1 9 9 2 1 9 9 4 1 9 9 6 1 9 9 8 2 2 2 2 4 2 6 2 8
PAGE 22 CREATING VALUE
PAGE 23 CREATING VALUE
PAGE 24 CREATING VALUE
PAGE 25 CREATING VALUE
PAGE 26 CREATING VALUE
PAGE 27 CREATING VALUE
PAGE 28 CREATING VALUE
PAGE 29 CREATING VALUE
PAGE 30 CREATING VALUE
0% 5% 10% 15% 20% 25% 30% 35% 40% 45% 50% V a c a n t F Y 6 F Y 7 F Y 8 F Y 9 F Y 1 F Y 1 + Year ended
0% 5% 10% 15% 20% 25% 30% 35% 40% 45% 50% Vacant FY06 FY07 FY08 FY09 FY10 FY10+ Year ended
PAGE 31 CREATING VALUE
PAGE 32 CREATING VALUE
PAGE 33 CREATING VALUE
PAGE 34 CREATING VALUE
1 VWAP adjusted for IOF distribution (26 September, 2.55¢pu)
PAGE 35 CREATING VALUE
PAGE 36 CREATING VALUE
This presentation has been prepared by ING Management Limited (“INGML”) in its capacity as responsible entity of the ING Office Fund (comprising Armstrong Jones Office Fund ARSN 090 242 229 and Prime Credit Property Trust ARSN 089 849 196) (collectively “IOF”) in connection with a proposed offer of units in IOF. This presentation and its contents have been distributed in confidence and may not be reproduced or disclosed to any other
By receiving this document, the recipient acknowledges and agrees that it is a “wholesale client” under section 761G of the Corporations Act 2001 (Cth) (‘Corporations Act’) and does not need to be given a disclosure document under Chapter 7.9 of the Corporations Act to receive this information or, if you are outside of Australia, you are otherwise qualified to receive this information in your jurisdiction. If you are not such an investor, please do not consider the contents of this document and return it to INGML. This presentation is not an offer, invitation, solicitation or recommendation with respect to the subscription for, purchase or sale
investors should make their own independent evaluation of an investment in IOF. Nothing in this presentation constitutes investment, legal, tax or other advice. Reliance should not be placed on the information or opinions contained in this
particular needs. The information does not purport to constitute all of the information that a potential investor may require in making an investment decision. INGML has prepared this presentation based on information available to it. No representation or warranty, express or implied, is made as to the fairness, accuracy, completeness or correctness of the information, opinions and conclusions contained in this presentation. Neither Citigroup Global Markets Australia Pty Limited, J.P. Morgan Australia Limited nor any of their directors, agents, officers or employees have authorised this presentation nor are responsible for the issue or making of any statement or contents of this presentation nor make any representation or warranty, express or implied, as to the accuracy or completeness of any information, statements, opinions or representations contained in this presentation. No responsibility for any errors or omissions from this presentation arising out of negligence or otherwise is accepted.