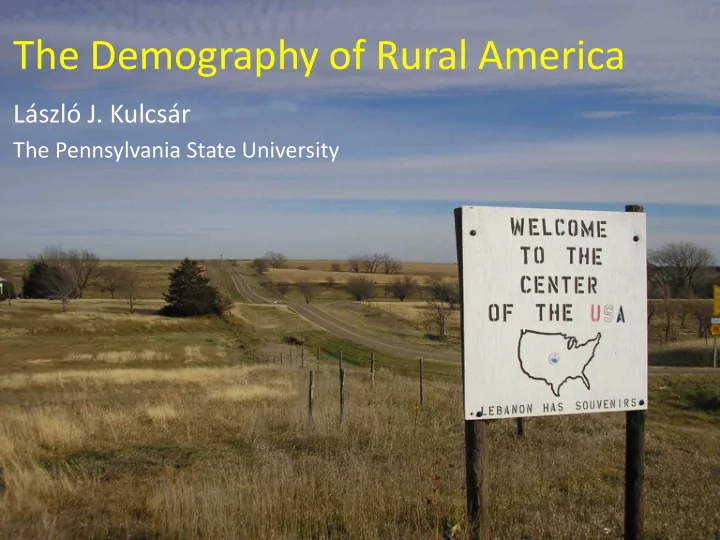

The Demography of Rural America László J. Kulcsár The Pennsylvania State University
Global urbanization trends 100 World The global crossover 90 MDRs 80 LDRs 70 Percent urban 60 50 40 30 20 10 0 United Nations, Department of Economic and Social Affairs, Population Division (2019). World Population Prospects: The 2019 Revision
The rural narrative • Until the 1970s, rural places were population reserves, with persistent outmigration and predictable, high fertility • The nonmetropolitan turnaround • Changes in residential preferences • Rural economic diversification • Demographic fluctuation and diverging pathways since the 1980s • Economic prosperity and demographic trends no longer go hand in hand (agricultural dependence) • Natural amenities have become more important • Proximity to urban is crucial • Many narratives
The rural narrative • Rural as a social construct (mostly from an urban perspective) • From production to consumption • The rural mystique • Rural is not a place anymore, but a lifestyle (for better of for worse)
US population, 1900-2010 (1000s) 300,000 Metropolitan Nonmetropolitan 250,000 200,000 150,000 100,000 50,000 0 1900 1910 1920 1930 1940 1950 1960 1970 1980 1990 2000 2010 United States Bureau of Census
US population distribution, 1900-2010, % metro core nonmetro suburb 80 70 60 50 40 30 20 10 0 1900 1910 1920 1930 1940 1950 1960 1970 1980 1990 2000 2010 United States Bureau of Census
Urban reclassification • Nonmetropolitan population was 46 million in 2016, an all- time low • A lot of this erosion is due to reclassification • A net loss of 4.9 million people in 2013
Population change, 2000-2010
Percent population change in rural America Population change 20 Net migration Natural increase 15.4 15 13.6 12.8 10.3 10 9.9 10 7.4 6.9 6.1 5.4 4.8 4.8 4.2 5 3.4 2.9 2.7 2.5 2.3 1.7 0 -2.8 -5 -5.1 -5.8 -10 -11.1 -12.5 -15 1930-40 1940-50 1950-60 1960-70 1970-80 1980-90 1990-2000 2000-2010 United States Bureau of Census
Total fertility rates, 1950-2015 4 Japan 3.8 Bulgaria 3.6 Germany 3.4 USA 3.2 3 2.8 2.6 2.4 2.2 2 1.8 1.6 1.4 1.2 1 1950-55 1955-60 1960-65 1965-70 1970-75 1975-80 1980-85 1985-90 1990-95 1995-00 2000-05 2005-10 2010-15 United Nations, Department of Economic and Social Affairs, Population Division (2019). World Population Prospects: The 2019 Revision
Fertility decline, 2007-2017 Total fertility rates by place Total fertility rates by race, rural only 2.4 3.5 2007 2017 2007 2017 3.21 2.21 2.2 2.1 3 1.95 2 2.5 1.8 2.32 1.71 2.09 1.6 2 1.91 1.4 1.5 1.2 1 1 Nonmetro Large metro NH White Hispanic NCHS, National Vital Statistics System, 2007–2017.
Mortality • The national mortality stagnation and persistent rural mortality / morbidity disadvantage are exacerbated by the recent “deaths of despair” Monnat, 2017
Cowley County, KS Sedgwick County, KS
Net migration rates by age Finney County, KS The Christmas fire, 2000 2000s 1980s and 1990s
Population change, 1900-2010 25,000 20,000 15,000 10,000 5,000 Seward County Smith County 0 1900 1910 1920 1930 1940 1950 1960 1970 1980 1990 2000 2010
Median age and projected age structure in Smith County, KS 50 Age structure, Smith County, 2030 49 US Smith 48 85+ 47 80-84 46 75-79 45 70-74 44 65-69 43 60-64 42 55-59 50-54 41 45-49 40 40-44 39 35-39 38 30-34 37 25-29 36 20-24 35 15-19 34 10-14 33 5-9 female 32 0-4 male 31 -200 -150 -100 -50 0 50 100 150 200 30 29 28 27 26 25 1950 1960 1970 1980 1990 2000 2010
Rural depopulation Economic change (labor displacement) Persistent net Urban out-migration of preference young adults Depopulation Age transition Distorted age structure and fertility decline Changes in family formation Mortality and morbidity disadvantage
The vicious cycle Population loss Loss of Loss of services consumers Loss of Loss of revenues businesses
More on the Great Recession % population change 8 7.4 6.3 5.6 6 4 2.4 1.7 2 NM Farming 0 -0.4 -2 NM NM Recreation Metro -1.8 -2.2 Manufacturing -4 2001-08 2010-17
Conclusions I. • Demographic trends will not change overnight • Demography is almost destiny, but not quite • Rural fertility • Family formation norms will continue to follow the national trends • Aging in place will continue to remove reproductive capacity • Hispanic fertility will remain the key • Mortality • Long-term, structural disadvantages are unlikely to change • New problems (opioids) disproportionately affect rural areas and populations • Migration • Age-selective outmigration removes the most resourceful segment • Specific local conditions can create favorable environments for in- migration (natural amenities, proximity to metro, regional centers)
Conclusions II. • Rural America has been facing more difficulties for several reasons • Greater concentration of vulnerable populations (morbidity challenges, aging in place) • Less diversified economies • Weaker institutions • Persistent revenue and service deficiencies • Most of rural America will see more of the same, as the disadvantages are structural and (just like demography) change slowly over time • Potential policy actions (Johnson and Lichter, 2019) • Economic growth centers (either regional urban or well-performing rural) • Boosting immigration and then integration • No matter what, always keep the narrative in sight, as in our post- truth world, the ultimate political decisions are often based on emotions and partisan agendas instead of facts and science
Thank you.
Recommend
More recommend