
SLIDE 1
Carol R. Collier, FAICP, FAWRA Academy of Natural Sciences Of Drexel University
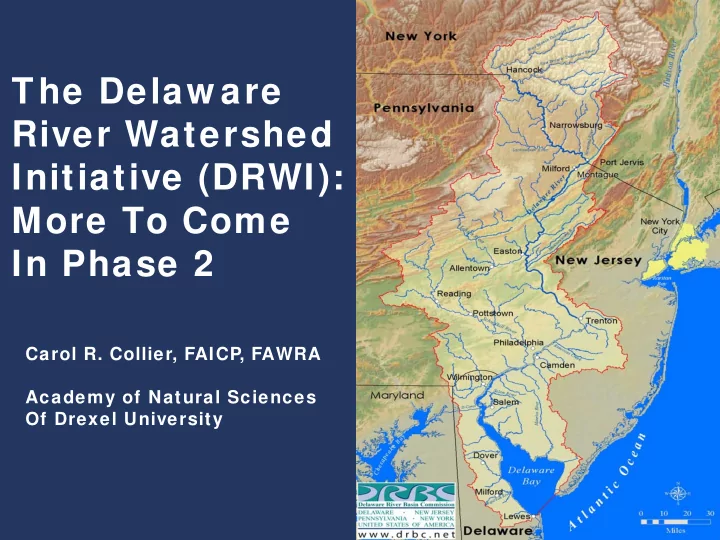
The Delaw are River Watershed Initiative (DRWI): More To Come In - - PowerPoint PPT Presentation
The Delaw are River Watershed Initiative (DRWI): More To Come In Phase 2 Carol R. Collier, FAICP, FAWRA Academy of Natural Sciences Of Drexel University THINGS TO THINK ABOUT o Are these issues that you are dealing with? o Are there
Carol R. Collier, FAICP, FAWRA Academy of Natural Sciences Of Drexel University
3
NJ Highlands
TNC (NJ) Musconetcong W.A. Wallkill River W’shed Mgmt. Group
Poconos-Kittatinny
TNC (PA) North Pocono CARE Brodhead W.A. East Stroudsburg Univ.
Schuylkill Highlands
Green Valleys Association French & Pickering Creeks Cons. Trust Hay Creek W.A. Berks County Conservancy Chester County Water Resources Auth. Stroud Water Research Center
Middle Schuylkill
Schuylkill Action Network Miller Environmental Stroud Water Research Center Berks County Conservancy
Upper Lehigh
Wildlands Conservancy Moravian University
Philadelphia
T
Wissahickon Valley W.A. Lower Merion Conservancy Pennypack Ecological Restoration Trust Friends of the Poquessing Villanova Univ. & T emple Univ.
Brandywine-Christina
Stroud Water Research Center
Kirkwood-Cohansey
Association of NJ Env. Commissions NJ Audubon Pinelands Preservation Alliance
Citizen Scientists
Students Volunteers
275 taxa 46 species 347* taxa
35 Integrative Sites: fish, algae, macroinvertebrates, habitat, salamanders, water chemistry (4x/yr) 77 Project Sites (algae, macroinvertebrates, habitat & water) 24 Fish Project Sites 15 Lentic macroinvertebrate sites 15 Salamander Sites 4 Stormwater Sites
Monitoring Site Stats
Tier Chemistry Chemistry Lab Macroinver- tebrate Sampling, ID level Fish Sampling Habitat Assessment Algae 1 ANS or
designated lab, YSI sonde Low detection levels Surber sampler Genus/ species Quantitative, multiple pass depletion sampling EPA WSA, Habitat Index, Riparian Index Multi- habitat (SWAMP Protocol) 2 Hach kit or
non- designated lab Higher detection levels Kick nets Family Single-pass, trout presence/ absence Habitat Index None 3 Hach kit or
chemistry kit No laboratory analysis Kick nets Family, order None Habitat Index, None None TRAINED VOLUNTEERS, QA/QC ANY VOLUNTEERS, NO QA/QC
POCONO KITTATINNY UPPER LEHIGH MIDDLE SCHUYLKILL SCHUYLKILL HIGHLANDS BRANDYWINE CHRISTINA UPSTREAM SUBURBAN PHILADELPHIA NEW JERSEY HIGHLANDS
Good Fair Poor
INFORMATION PERSPECTIVES
All Levels
Assessments
Assessments
Source Data
Outputs Compiled
Targets
Multidimensional Scaling
Changes and Population Growth
Physics
Benchmarks
Planning Management
Plan
Data and Reports
Warning System
Sediment Loading
Forecast Maps
1 meter resolution 7 land use categories
Sleuth Model and local input Land Use Change Forecasts
Stream Reach Assessment Tool (SRAT)
Stream Reach Reach Catchment (Non Fluvial Flow)
Estimated TP mg/l 0.18
Estimated TN MG/L 22.5 Estimated TP MG/L 1.1
Point Sources Ag Sources Urban Sources
Incompatible agricultural practices Poor water quality Incompatible sub/urbanization Impact of development & growth Pollutants Lost, degraded and fragmented habitat Reduced natural cover and functionality Lack of economic and policy incentives Impacts to the natural flow regime Energy infrastructure Acid mine drainage Incompatible stewardship ethic Dams, barriers Point source discharge Altered hydrology Organizations working in isolation Lack of understanding of watershed systems
Direct Threats Contributing Factors
Key
Ecosystem stressors Conservation Target Goal