SLIDE 1 The Confirmation for the Assumption of Full Seismic Correlation in multi-unit Seismic Probabilistic Safety Assessment
Geon Gyu Choi.a∗, Woo Sik Jung.a
.𝑏Sejong University, Nuclear Engineering Dept., 209, Neungdong-Ro, Kwangjin-Gu Seoul, Korea. .∗Corresponding author: choigg0330@gmail.com
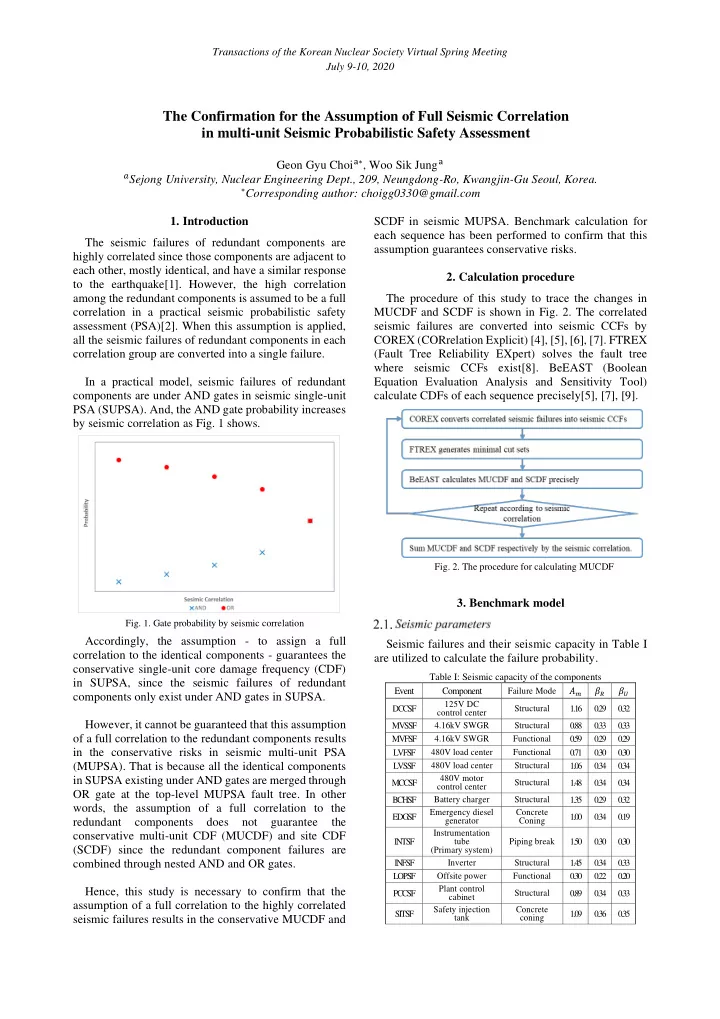
The seismic failures of redundant components are highly correlated since those components are adjacent to each other, mostly identical, and have a similar response to the earthquake[1]. However, the high correlation among the redundant components is assumed to be a full correlation in a practical seismic probabilistic safety assessment (PSA)[2]. When this assumption is applied, all the seismic failures of redundant components in each correlation group are converted into a single failure. In a practical model, seismic failures of redundant components are under AND gates in seismic single-unit PSA (SUPSA). And, the AND gate probability increases by seismic correlation as Fig. 1 shows. Accordingly, the assumption - to assign a full correlation to the identical components - guarantees the conservative single-unit core damage frequency (CDF) in SUPSA, since the seismic failures of redundant components only exist under AND gates in SUPSA. However, it cannot be guaranteed that this assumption
- f a full correlation to the redundant components results
in the conservative risks in seismic multi-unit PSA (MUPSA). That is because all the identical components in SUPSA existing under AND gates are merged through OR gate at the top-level MUPSA fault tree. In other words, the assumption of a full correlation to the redundant components does not guarantee the conservative multi-unit CDF (MUCDF) and site CDF (SCDF) since the redundant component failures are combined through nested AND and OR gates. Hence, this study is necessary to confirm that the assumption of a full correlation to the highly correlated seismic failures results in the conservative MUCDF and SCDF in seismic MUPSA. Benchmark calculation for each sequence has been performed to confirm that this assumption guarantees conservative risks.
The procedure of this study to trace the changes in MUCDF and SCDF is shown in Fig. 2. The correlated seismic failures are converted into seismic CCFs by COREX (CORrelation Explicit) [4], [5], [6], [7]. FTREX (Fault Tree Reliability EXpert) solves the fault tree where seismic CCFs exist[8]. BeEAST (Boolean Equation Evaluation Analysis and Sensitivity Tool) calculate CDFs of each sequence precisely[5], [7], [9].
Seismic failures and their seismic capacity in Table I are utilized to calculate the failure probability.
Table I: Seismic capacity of the components Event Component
Failure Mode
𝐵𝑛 𝛾𝑆 𝛾𝑉
DCCSF 125V DC control center Structural 1.16 0.29 0.32 MVSSF 4.16kV SWGR Structural 0.88 0.33 0.33 MVFSF 4.16kV SWGR Functional 0.59 0.29 0.29 LVFSF 480V load center Functional 0.71 0.30 0.30 LVSSF 480V load center Structural 1.06 0.34 0.34 MCCSF 480V motor control center Structural 1.48 0.34 0.34 BCHSF Battery charger Structural 1.35 0.29 0.32 EDGSF Emergency diesel generator Concrete Coning 1.00 0.34 0.19 INTSF Instrumentation tube (Primary system) Piping break 1.50 0.30 0.30 INFSF Inverter Structural 1.45 0.34 0.33 LOPSF Offsite power Functional 0.30 0.22 0.20 PCCSF Plant control cabinet Structural 0.89 0.34 0.33 SITSF Safety injection tank Concrete coning 1.09 0.36 0.35
- Fig. 1. Gate probability by seismic correlation
- Fig. 2. The procedure for calculating MUCDF
Transactions of the Korean Nuclear Society Virtual Spring Meeting July 9-10, 2020
SLIDE 2 The mean seismic frequency is divided into several intervals by peak ground acceleration (PGA) based on the latest research of seismic PSA, Surry pilot plant review[3] as Table II below.
Table II: Mean seismic frequency intervals by PGA
Interval groups PGA interval [m/s2] Representative PGA [m/s2] Mean seismic frequency [yr−1] 1 0.05 ~ 0.10 0.075 1.2070E-03 2 0.10 ~ 0.15 0.125 3.7700E-04 3 0.15 ~ 0.20 0.175 6.9100E-05 4 0.20 ~ 0.25 0.225 2.1000E-05 5 0.25 ~ 0.30 0.275 8.1500E-06 6 0.30 ~ 0.50 0.400 3.6500E-06 7 0.50 ~ 0.70 0.600 2.3400E-06 8 0.70 ~ 1.00 0.850 1.2370E-06
The seismic event tree in Fig. 3 is used for benchmark
- calculation. The sequences that can cause core damage
in consequence of random failures are neglected, and human errors are considered as a TRUE event. This study is performed to confirm how categorizing seismic failures affects MUCDF and SCDF. Accordingly, two different models are utilized. In Model A, the seismic failures of identical components in the same unit are converted into a single. Whereas, Model B has all the seismic failures. In the case of calculating SCDF, the correlated seismic failures of identical components under AND gates are inevitable to be merged through OR gates at the top-level
- f the seismic MUPSA fault tree as shown in Fig. 5.
The groups of correlated seismic failures for Models A and B are listed in Table III and Table IV respectively.
Table III: Correlation group for Model A
Correlation Group Event Failure Mode Component Unit 1 Unit 2 1 U1-EDGSF U2-EDGSF Concrete coning Emergency diesel generator 2 U1-MVSSF U2-MVSSF Structural 4.16kV SWGR 3 U1-MVFSF U2-MVFSF Functional 4.16kV SWGR 4 U1-LVSSF U2-LVSSF Functional 480V Load center 5 U1-LVFSF U2-LVFSF Structural 480V Load center 6 U1-MCCSF U2-MCCSF Functional 480V Motor control center 7 U1-PCCSF U2-PCCSF Structural Plant control cabinet 8 U1-DCCSF U2-DCCSF Structural 125V DC control center 9 U1-BCHSF U2-BCHSF Structural Battery charger 10 U1-SITSF U2-SITSF Concrete Coning Safety injection tank 11 U1-INFSF U2-INFSF Structural Inverter
In Table IV, the more six seismic failures in the same unit is assumed as a single failure. For instance, U1- DCCSF_A and U1-DCCSF_C are converted to U1- DCCSF_A.
- Fig. 3. Seismic PSA event tree
- Fig. 4 Fault trees for MUCDF
(a) Model A (b) Model B
- Fig. 5 Fault trees for SCDF
(a) Model A (b) Model B
Transactions of the Korean Nuclear Society Virtual Spring Meeting July 9-10, 2020
SLIDE 3 Table IV: Correlation group for Model B
Correlation Group Event Failure Mode Component Unit 1 Unit 2 1 U1-EDGSF_A U1-EDGSF_B U2-EDGSF_A U2-EDGSF_B Concrete coning Emergency diesel generator 2 U1-MVSSF_A U1-MVSSF_B U2-MVSSF_A U2-MVSSF_B Structural 4.16kV SWGR 3 U1-MVFSF_A U1-MVFSF_B U2-MVFSF_A U2-MVFSF_B Functional 4.16kV SWGR 4 U1-LVSSF_A U1-LVSSF_B U2-LVSSF_A U2-LVSSF_B Functional 480V Load center 5 U1-LVFSF_A U1-LVFSF_B U2-LVFSF_A U2-LVFSF_B Structural 480V Load center 6 U1-MCCSF_A U1-MCCSF_B U2-MCCSF_A U2-MCCSF_B Functional 480V Motor control center 7 U1-PCCSF_A U1-PCCSF_B U2-PCCSF_A U2-PCCSF_B Structural Plant control cabinet 8 U1-DCCSF_A U1-DCCSF_B U2-DCCSF_A U2-DCCSF_B Structural 125V DC control center 9 U1-BCHSF_A U1-BCHSF_B U2-BCHSF_A U2-BCHSF_B Structural Battery charger 10 U1-SITSF_A U1-SITSF_B U2-SITSF_A U2-SITSF_B Concrete Coning Safety injection tank 11 U1-INFSF_A U1-INFSF_B U2-INFSF_A U2-INFSF_B Structural Inverter
The correlated seismic failures in each group of Table III and Table IV are converted into seismic CCFs, and then FTREX solves the fault tree to generate seismic
- MCSs. Lastly, BeEAST calculates MUCDFs of
sequences accurately. As shown in Fig. 6, sequence MUCDFs of Models A and B increase by seismic correlation and concenter into a similar value in MUCDF fault tree. Nevertheless, sequence MUCDFs of Model A is
- verestimated from 0.0 to 0.9 because Model A has a
single failure of identical components in the same unit. As shown in Fig. 7, sequence SCDFs of Model A are greater than those of Model B at all the seismic correlation level. Nonetheless, each sequence SCDFs of Models A and B converge into the identical value. The more seismic failures of identical components are correlated, the higher sequence SCDFs of Model B is. Whereas the sequence SCDFs of Model A decreases as seismic correlation increases. The sequence SCDFs of Model A at a particular correlation level is excessively
- verestimated comparing those of Model B.
Therefore, all the seismic failures of redundant components must exist in the fault tree to avoid the
- verestimated MUCDF and SCDF in seismic MUPSA.
- 5. Conclusions
CDFs of sequences are calculated to confirm that the assumption of a full correlation guarantees the conservative risks. As the seismic correlation increases, CDFs changes as below. Sequence MUCDFs of Models A and B increase and converge into a similar value. Sequence SCDFs of Model B increases, whereas that of Model A decrease. Nevertheless, SCDFs of Models A and B converge into a similar value. However, Sequence CDFs of Model A are greater than those of Model B at all the seismic correlation level. Accordingly, the conclusion can be drawn as follows. The assumption of a full correlation guarantees the conservative MUCDF, and SCDF regardless of Models A and B. Model A cannot be utilized to calculate SCDF if a partial correlation exists in seismic MUPSA, because SCDF of Model A is excessively
- verestimated as unacceptable.
Model B should be used for seismic MUPSA where a partial correlation exists. Namely, all the seismic failures of redundant components that are partially correlated should exist in seismic MUPSA.
- Fig. 6. Sequence MUCDFs fault tree by seismic correlation
- Fig. 7. Sequence SCDFs fault tree by seismic correlation
Transactions of the Korean Nuclear Society Virtual Spring Meeting July 9-10, 2020
SLIDE 4
REFERENCES
[1] EPRI, Seismic Probabilistic Risk Assessment Implementation Guide, 2003. [2] U.S. NRC, Correlation of Seismic Performance in Similar SSCs (Structures, Systems, and Components), NUREG-7237, 2017. [3] EPRI, Surry Seismic Probabilistic Risk Assessment Pilot Plant Review, 2010. [4] W. S. Jung, K. Hwang, and S. K. Park, A new method to allocate combination probabilities of correlated seismic failures into CCF probabilities, 2019 International Topical Meeting on Probabilistic Safety Assessment and Analysis (PSA 2019), Charleston, SC, April 28 - May 3, 2019. [5] W. S. Jung, How to Convert Correlated Seismic Failures into Seismic CCFs, Korea Nuclear Society, 2019. [6] S. K. Park, W. S. Jung, and K.S. Kim, Seismic Correlation Application Study with COREX, Transactions of the Korean Nuclear Society Spring Meeting, 2019. [7] S. K. Park, W. S. Jung, and K.S. Kim, Validation Study for Seismic Correlation Analysis SW COREX, Transactions of the Korean Nuclear Society Spring Meeting, 2019. [8] W. S. Jung, S. H. Han, and J. J. Ha, Advanced Features of the Fault Tree Solver FTREX, Korea Atomic Energy Research Institute (KAERI), 2005. [9] D. I. Kang, and Y. H. Jung, Comparative Studies on the Modeling Approaches of Fire-Induced Component Failure Events for a Fire Event PSA, Transactions of the Korean Nuclear Society Spring Meeting, 2019. Transactions of the Korean Nuclear Society Virtual Spring Meeting July 9-10, 2020