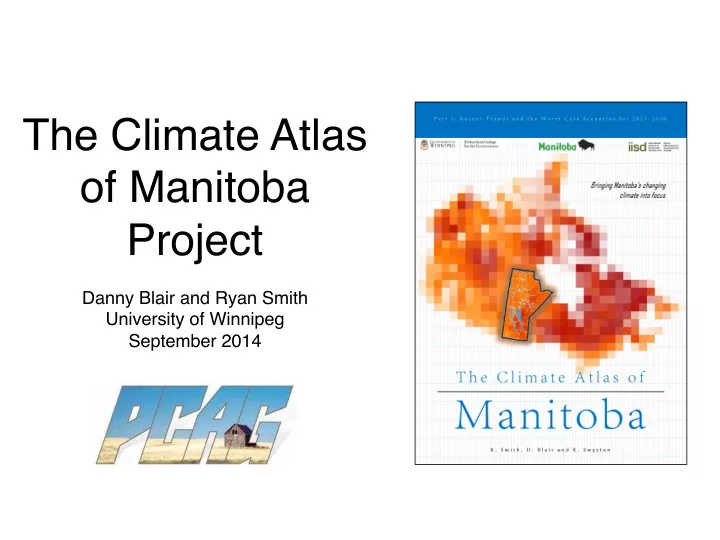
The Climate Atlas of Manitoba Project Danny Blair and Ryan Smith - - PowerPoint PPT Presentation

the climate atlas of manitoba project
SMART_READER_LITE
LIVE PREVIEW

The Climate Atlas of Manitoba Project Danny Blair and Ryan Smith - - PowerPoint PPT Presentation

The Climate Atlas of Manitoba Project Danny Blair and Ryan Smith University of Winnipeg September 2014 The Climate Atlas of Manitoba Project Funding provided by: Randall Shymko at MB Climate


slide-1
SLIDE 1

The Climate Atlas

  • f Manitoba

Project

  • Danny Blair and Ryan Smith

University of Winnipeg September 2014 ¡

slide-2
SLIDE 2

The Climate Atlas of Manitoba Project ¡

Funding ¡provided ¡by: ¡

  • Randall ¡Shymko ¡at ¡MB ¡Climate ¡& ¡

Green ¡Ini>a>ves ¡Branch ¡ Researchers: ¡

  • Danny ¡Blair ¡& ¡Ryan ¡Smith, ¡

UWinnipeg’s ¡Richardson ¡College ¡ for ¡the ¡Environment ¡

  • Kyle ¡Swystun, ¡IISD ¡

Expert ¡advice: ¡

  • MaKhew ¡Wiens, ¡MB ¡Agri-­‑

Environment ¡ ¡Knowledge ¡Centre ¡

slide-3
SLIDE 3

General ¡objec>ves: ¡

¡

  • Produce ¡high-­‑quality ¡up-­‑to-­‑date ¡maps ¡of ¡climate ¡

condi>ons ¡across ¡MB ¡

  • Assess ¡and ¡map ¡recent ¡climate ¡trends ¡across ¡MB ¡
  • If ¡possible, ¡make ¡maps ¡of ¡climate ¡condi>ons ¡

projected ¡for ¡Manitoba ¡in ¡upcoming ¡decades ¡(mid-­‑ century) ¡

  • Produce ¡output ¡in ¡a ¡format ¡accessible ¡to, ¡and ¡

understandable ¡by, ¡many ¡stakeholders, ¡including ¡the ¡ public ¡

slide-4
SLIDE 4

Challenges: ¡ ¡

  • Quality ¡of ¡historical ¡climate ¡data ¡in ¡MB; ¡Environment ¡

Canada’s ¡climate ¡sta>on ¡data ¡is ¡not ¡evenly ¡distributed ¡ through ¡space ¡and ¡>me ¡

  • Most ¡recent ¡climate ¡model ¡data ¡(CMIP5) ¡is ¡available, ¡

but ¡only ¡in ¡course ¡resolu>on; ¡>me-­‑consuming ¡and ¡ expensive ¡to ¡process ¡

  • Higher ¡resolu>on ¡CMIP5 ¡data ¡only ¡available ¡from ¡one ¡

model, ¡for ¡one ¡emissions ¡scenario ¡

  • The ¡processing ¡of ¡these ¡data ¡s>ll ¡very ¡>me ¡consuming ¡
  • The ¡>meline ¡for ¡the ¡project ¡is ¡short ¡
  • The ¡budget ¡for ¡the ¡project ¡is ¡small… ¡and ¡has ¡not ¡been ¡

renewed! ¡

slide-5
SLIDE 5

Choices: ¡ ¡

  • Use ¡NRCan’s ¡gridded ¡dataset ¡of ¡daily ¡1950-­‑2012 ¡

temperatures ¡and ¡precipita>on ¡to ¡depict ¡current ¡ climate ¡and ¡recent ¡trends ¡

  • Use ¡Canada’s ¡CANRCM4 ¡regional ¡climate ¡model ¡data ¡

for ¡future ¡projec>ons ¡

  • Use ¡RCP8.5 ¡emissions ¡scenario ¡
  • Use ¡in-­‑house ¡climate ¡mapping ¡sobware ¡wriKen ¡(by ¡

Ryan ¡Smith) ¡in ¡IDL ¡programming ¡language ¡to ¡process ¡ and ¡map ¡data ¡

  • Use ¡1971-­‑2010 ¡to ¡assess ¡recent ¡trends ¡
  • Use ¡1981-­‑2010 ¡for ¡some ¡climate ¡maps ¡
  • Use ¡2021-­‑2050 ¡to ¡represent ¡‘the ¡future’ ¡
slide-6
SLIDE 6

Daily ¡Historical ¡Data ¡

slide-7
SLIDE 7

Bulle>n ¡of ¡the ¡American ¡Meteorological ¡Society: ¡December ¡2011 ¡

slide-8
SLIDE 8
slide-9
SLIDE 9
slide-10
SLIDE 10
slide-11
SLIDE 11

NRCan ¡gridded ¡dataset: ¡

  • Resolu>on ¡is ¡300 ¡arc ¡seconds ¡(very ¡close ¡to ¡10 ¡km) ¡
  • Daily ¡maximum ¡temperature ¡(°C) ¡
  • Daily ¡minimum ¡temperature ¡(°C) ¡
  • Daily ¡total ¡precipita>on ¡(mm) ¡
  • Years ¡1950-­‑2010, ¡currently ¡(leap ¡year ¡days ¡included) ¡
  • Domain: ¡141.00 ¡to ¡52.00 ¡W, ¡41.00 ¡to ¡83.00 ¡N ¡
  • Datum: ¡Geographic ¡NAD83 ¡
slide-12
SLIDE 12

Very ¡confident ¡in ¡the ¡quality ¡of ¡the ¡daily ¡ temperatures ¡in ¡the ¡NRCan ¡10-­‑km ¡gridded ¡

  • dataset. ¡

Less ¡confident ¡in ¡the ¡quality ¡of ¡the ¡daily ¡ precipita>on ¡data. ¡

slide-13
SLIDE 13
slide-14
SLIDE 14

Model ¡Data ¡

slide-15
SLIDE 15
slide-16
SLIDE 16

RCP8.5 ¡ RCP6.0 ¡ RCP4.5 ¡ RCP2.6 ¡ 2.3 ¡W/m2 ¡ so ¡far ¡

Representative Concentration Pathways (RCPs)

slide-17
SLIDE 17
slide-18
SLIDE 18

CMIP5 ¡= ¡Coupled ¡Model ¡ Intercomparison ¡Project ¡ Phase ¡5 ¡ EMIC ¡= ¡Earth ¡System ¡Model ¡

  • f ¡Intermediate ¡Complexity ¡

(lower ¡resolu>on ¡than ¡typical ¡ AOGCMs) ¡ Average ¡1961-­‑90 ¡global ¡ temperature ¡simulated ¡ by ¡models ¡

IPCC ¡AR5 ¡Chapter ¡8 ¡

slide-19
SLIDE 19

EXAMPLE ¡OF ¡DIFFERENCES ¡BETWEEN ¡NRCan ¡GRIDDED ¡ AND ¡CANRCM4 ¡(RCP8.5) ¡TEMPERATURE ¡DATA ¡

AVERAGE ¡ANNUAL ¡MAXIMUM ¡TEMPERATURE ¡AT ¡GRIDPOINT ¡CLOSEST ¡TO ¡WINNIPEG ¡ NRCan ¡ CANRCM4 ¡ Average ¡delta ¡= ¡3.35oC ¡

slide-20
SLIDE 20

January ¡Average ¡Maximum ¡Temperature ¡Delta ¡Map ¡ ¡

slide-21
SLIDE 21

July ¡Average ¡Minimum ¡Temperature ¡Delta ¡Map ¡ ¡

slide-22
SLIDE 22

January ¡Precipita>on ¡Delta ¡Map ¡ ¡

slide-23
SLIDE 23

July ¡Precipita>on ¡Delta ¡Map ¡ ¡

slide-24
SLIDE 24

Enough ¡of ¡the ¡boring ¡stuff. ¡ ¡ Introducing…The ¡Climate ¡Atlas! ¡

slide-25
SLIDE 25
slide-26
SLIDE 26
slide-27
SLIDE 27
slide-28
SLIDE 28
slide-29
SLIDE 29
slide-30
SLIDE 30
slide-31
SLIDE 31

Trend ¡in ¡Annual ¡Number ¡of ¡Days ¡<= ¡-­‑30oC ¡(1971-­‑2010) ¡ (NRCan ¡10-­‑km ¡gridded ¡daily ¡data) ¡

Ryan ¡Smith ¡ and ¡Danny ¡ Blair ¡

NRCan ¡Data ¡Ref: ¡Hutchinson, ¡ Michael ¡F., ¡Dan ¡W. ¡McKenney, ¡ Kevin ¡Lawrence, ¡John ¡H. ¡Pedlar, ¡ Ron ¡F. ¡Hopkinson, ¡Ewa ¡Milewska, ¡ Pia ¡Papadopol, ¡2009: ¡ Development ¡and ¡Tes>ng ¡of ¡ Canada-­‑Wide ¡Interpolated ¡ Spa>al ¡Models ¡of ¡Daily ¡ Minimum–Maximum ¡ Temperature ¡and ¡Precipita>on ¡ for ¡1961–2003.J. ¡Appl. ¡Meteor. ¡ Climatol., ¡48, ¡725–741. ¡ ¡ Hopkinson, ¡Ron ¡F., ¡Daniel ¡W. ¡ McKenney, ¡Ewa ¡J. ¡Milewska, ¡ Michael ¡F. ¡Hutchinson, ¡Pia ¡ Papadopol, ¡Lucie ¡A. ¡Vincent, ¡ 2011: ¡Impact ¡of ¡Aligning ¡ Climatological ¡Day ¡on ¡Gridding ¡ Daily ¡Maximum–Minimum ¡ Temperature ¡and ¡Precipita>on ¡

  • ver ¡Canada. ¡J. ¡Appl. ¡Meteor. ¡

Climatol., ¡50, ¡1654–1665. ¡

slide-32
SLIDE 32

0 ¡ 20 ¡ 40 ¡ 60 ¡ 80 ¡ 100 ¡ 120 ¡ 140 ¡ 160 ¡ 180 ¡

1951 ¡ 1952 ¡ 1953 ¡ 1954 ¡ 1955 ¡ 1956 ¡ 1957 ¡ 1958 ¡ 1959 ¡ 1960 ¡ 1961 ¡ 1962 ¡ 1963 ¡ 1964 ¡ 1965 ¡ 1966 ¡ 1967 ¡ 1968 ¡ 1969 ¡ 1970 ¡ 1971 ¡ 1972 ¡ 1973 ¡ 1974 ¡ 1975 ¡ 1976 ¡ 1977 ¡ 1978 ¡ 1979 ¡ 1980 ¡ 1981 ¡ 1982 ¡ 1983 ¡ 1984 ¡ 1985 ¡ 1986 ¡ 1987 ¡ 1988 ¡ 1989 ¡ 1990 ¡ 1991 ¡ 1992 ¡ 1993 ¡ 1994 ¡ 1995 ¡ 1996 ¡ 1997 ¡ 1998 ¡ 1999 ¡ 2000 ¡ 2001 ¡ 2002 ¡ 2003 ¡ 2004 ¡ 2005 ¡ 2006 ¡ 2007 ¡ 2008 ¡ 2009 ¡ 2010 ¡ 2011 ¡ 2012 ¡ 2013 ¡ 2014 ¡ 2015 ¡

Annual ¡Number ¡o ¡Days ¡Below ¡ Year ¡

Alert, ¡Nunavut: ¡Annual ¡Number ¡of ¡Cold ¡Days, ¡1951-­‑2012 ¡

Days ¡<= ¡-­‑30oC ¡ Days ¡<= ¡-­‑35oC ¡ Days ¡<= ¡-­‑40oC ¡

Years ¡with ¡> ¡10 ¡days ¡missing ¡not ¡included ¡ Data ¡Source: ¡Environment ¡Canada ¡ Days ¡Missing ¡

Produced ¡by ¡Danny ¡Blair ¡

slide-33
SLIDE 33

0 ¡ 20 ¡ 40 ¡ 60 ¡ 80 ¡ 100 ¡ 120 ¡ 140 ¡ 160 ¡

1971 ¡ 1972 ¡ 1973 ¡ 1974 ¡ 1975 ¡ 1976 ¡ 1977 ¡ 1978 ¡ 1979 ¡ 1980 ¡ 1981 ¡ 1982 ¡ 1983 ¡ 1984 ¡ 1985 ¡ 1986 ¡ 1987 ¡ 1988 ¡ 1989 ¡ 1990 ¡ 1991 ¡ 1992 ¡ 1993 ¡ 1994 ¡ 1995 ¡ 1996 ¡ 1997 ¡ 1998 ¡ 1999 ¡ 2000 ¡ 2001 ¡ 2002 ¡ 2003 ¡ 2004 ¡ 2005 ¡ 2006 ¡ 2007 ¡ 2008 ¡ 2009 ¡ 2010 ¡ 2011 ¡ 2012 ¡ 2013 ¡ 2014 ¡ 2015 ¡

Annual ¡Number ¡o ¡Days ¡Below ¡ Year ¡

Resolute, ¡Nunavut: ¡Annual ¡Number ¡of ¡Cold ¡Days, ¡1971-­‑2012 ¡

Days ¡<= ¡-­‑30oC ¡ Days ¡<= ¡-­‑35oC ¡ Days ¡<= ¡-­‑40oC ¡

Years ¡with ¡> ¡10 ¡days ¡missing ¡not ¡included ¡ Data ¡Source: ¡Environment ¡Canada ¡ Days ¡Missing ¡

Produced ¡by ¡Danny ¡Blair ¡

slide-34
SLIDE 34
slide-35
SLIDE 35
slide-36
SLIDE 36
slide-37
SLIDE 37
slide-38
SLIDE 38
slide-39
SLIDE 39
slide-40
SLIDE 40
slide-41
SLIDE 41
slide-42
SLIDE 42
slide-43
SLIDE 43

ANNUAL ¡TOTAL ¡PRECIPITATION ¡TOTALS ¡IN ¡WINNIPEG ¡

CANRCM4 ¡ AIRPORT ¡ NRCan ¡Gridded ¡

slide-44
SLIDE 44

Other ¡things ¡the ¡program ¡can ¡do: ¡

  • Produce ¡high-­‑quality, ¡print-­‑ready ¡maps ¡
  • Output ¡data ¡in ¡Excel ¡format ¡
  • Compute ¡“outlier ¡resistant” ¡p-­‑values ¡
  • Draw ¡custom ¡shape ¡files ¡
slide-45
SLIDE 45

Other ¡maps ¡the ¡program ¡can ¡make: ¡

  • Max, ¡min ¡and ¡mean ¡temperatures ¡
  • Extreme ¡hot/cold ¡days ¡ ¡
  • Degree-­‑days ¡
  • Corn ¡heat ¡units ¡
  • Frost-­‑free ¡period ¡
  • Frost ¡risk ¡
  • Precipita>on ¡
  • Heavy ¡precipita>on ¡events ¡
slide-46
SLIDE 46

Other ¡maps ¡we ¡would ¡like ¡to ¡make: ¡

  • Moving ¡average ¡maps ¡
  • Forest ¡fire ¡risk ¡
  • N-­‑day ¡precipita>on ¡totals ¡
  • Runs ¡of ¡days ¡without ¡precipita>on ¡
  • Runs ¡of ¡cold/hot ¡days ¡

¡

slide-47
SLIDE 47

Other ¡maps ¡You ¡want ¡to ¡see ¡made? ¡

  • How ¡might ¡you ¡integrate ¡the ¡Climate ¡Atlas ¡

into ¡your ¡research? ¡

  • Do ¡you ¡have ¡money? ¡
slide-48
SLIDE 48

THANK ¡YOU! ¡

Find ¡the ¡first ¡drab ¡of ¡the ¡Climate ¡ Atlas ¡Project ¡on ¡our ¡website: ¡ ¡ hKp://climate.uwinnipeg.ca ¡