
SLIDE 1
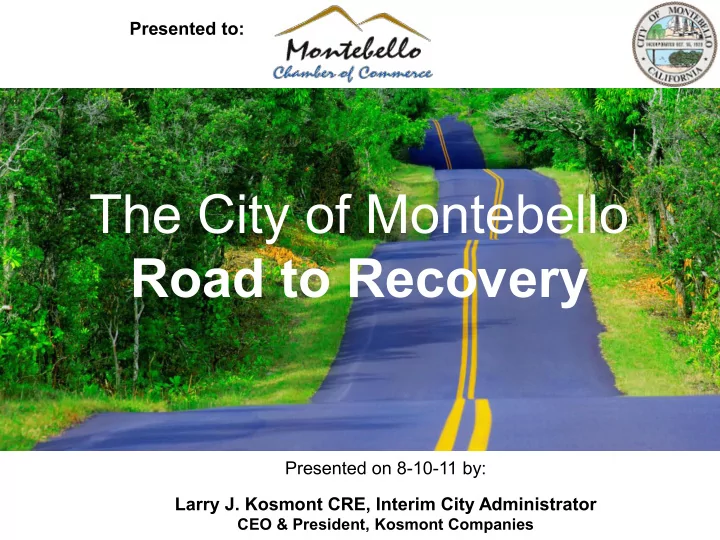
The City of Montebello Road to Recovery
Presented on 8-10-11 by: Larry J. Kosmont CRE, Interim City Administrator
CEO & President, Kosmont Companies
Presented to:
The City of Montebello Road to Recovery Presented on 8-10-11 by: - - PowerPoint PPT Presentation
Presented to: The City of Montebello Road to Recovery Presented on 8-10-11 by: Larry J. Kosmont CRE, Interim City Administrator CEO & President, Kosmont Companies Todays Agenda State of the State Montebello Road to Recovery
Presented on 8-10-11 by: Larry J. Kosmont CRE, Interim City Administrator
CEO & President, Kosmont Companies
Presented to:
Today’s Agenda
2
3
California New Years Eve…2006
4
BAN ANKS BUDGET ET
LEGISLATURE RED EDEVELOPMENT AGENCIES
US
JOBS
How long does this Hangover last?
ECONOMIC DEVELOPMENT? FED FIXES HAVE NOT WORKED & PRIVATE SECTOR STUCK
LOCAL GOVERNMENT DISTRESS
STATE FINANCIAL DISTRESS CONTINUES
Source: Bloomberg; LA Times; Washington Post; Milken Inst.; US Bureau of Labor Statistics
6
REAL ESTATE MARKETS SHOW LITTLE SIGN OF RECOVERY
LABOR MARKETS CONTINUE TO LANGUISH
Downward Spiral Continues
Source: California Department of Finance
7
UNEMPLOYMENT HOUSING GOVERNMENT
California’s Triple Threat
8
Competitiveness is Key
As California raises its taxes, it continues to lose businesses to Arizona, Colorado & Nevada
8.84%
Corporate Income Tax
AZ CO
NV
CA
4.63%
Corporate Income Tax
6.97%
Corporate Income Tax
Does Not Assess
Corporate Income Tax
CA 8.25% State Sales Tax AZ 5.6% State Sales Tax CO 2.9% State Sales Tax NV 6.85% State Sales Tax
9
Pensions are placing heavy strains on state, county and city governments
with pensions at 90% of salary
pensions > $100,000 annually
funded, as of 2010
EXCEED $500B dollars over next 16 years
The Future is Expensive
Source: California Foundation for Fiscal Responsibility
10
To Make Matters Worse: Redevelopment at Risk
CLOSE DOWN!
PAY UP
11
CEASE OPERATIONS Under AB1x26 Redevelopment Agencies ordered to wind down activities by October 1, 2011 Agencies are prohibited from taking any actions until adopt PAY-TO PLAY PAY TO PLAY Under AB1x27 Local RDAs have “voluntary option” to pay the State annual “Net Tax Increment” Total Payments = $1.7B in 2011-12 $400M ongoing MUST ENACT BY 11/1/11
12 12
California Redevelopment Agencies are still alive but severely impaired
to afford future annual payments
have prevented tax increment taken by State
$1.7 Billion in 2011-12
Potentially $400 million each year thereafter
Redevelopment…the end may be near
City’s Take the Hit
13
Los Angeles County RDA Dept of Finance 2011 Calculations Agoura Hills RDA 1,176,985 Alhambra RDA 4,371,157 Arcadia RDA 1,471,053 Artesia RDA 556,439 Avalon CIA 1,026,348 Azusa RDA 860,944 Baldwin Park RDA 2,090,636 Bell CRA 1,100,812 Bell Gardens RDA 29,172 Bellflower RDA 129,294 Burbank RDA 18,425,093 Carson RDA 11,890,405 Cerritos RDA 9,339,030 Compton CRA 10,493,243 Covina RDA 2,817,817 Claremont RDA 1,345,743 Commerce CDC 4,663,412 Cudahy RDA 1,021,060 Culver City RDA 12,044,227 Downey CDC 1,281,573 Duarte RDA 2,205,376 El Monte RDA 775,472 Glendale RDA 11,823,360 Glendora CRA 2,562,396 Los Angeles County RDA Dept of Finance 2011 Calculations Hawaiian Gardens RDA 1,590,022 Hawthorne CRA 4,347,052 Huntington Park CDC 3,945,327 Industry UDA 12,806,086 Inglewood RDA 7,184,326 Irwindale CRA 4,314,510 La Mirada RDA 3,580,648 La Puente RDA 215,894 La Verne RDA 2,469,019 Lakewood RDA 2,309,859 Lancaster RDA 15,184,504 Lawndale RDA 2,117,567 Long Beach RDA 33,851,971 Lynwood RDA 2,582,685 Los Angeles County CDC 1,844,955 Los Angeles CRA 96,528,881 Maywood RDA 1,290,465 Monrovia RDA 1,085,311 Montebello CRA 6,163,098 Monterey Park CRA 2,673,546 Norwalk RDA 745,658 Palmdale RDA 11,492,226 Paramount RDA 4,111,090 Los Angeles County RDA Dept of Finance 2011 Calculations Pico Rivera RDA 754,830 Pomona RDA 7,858,648 Rancho Palos Verdes RDA 91,320 Redondo Beach RDA 940,818 Rosemead CDC 2,096,364 San Dimas RDA 1,753,485 San Fernando RDA 2,185,859 San Gabriel RDA 469,154 Santa Clarita RDA 714,756 Santa Fe Springs RDA 9,259,313 Santa Monica RDA 26,830,703 Sierra Madre CRA 670,972 Signal Hill RDA 3,847,811 South El Monte RDA 1,477,105 South Gate RDA 1,677,415 South Pasadena CRA 225,250 Temple City CRA 198,175 Torrance RDA 1,621,149 Vernon RDA 4,964,889 Walnut IA 4,099,671 West Covina RDA 5,857,993 West Hollywood RDA 2,802,253 Whittier RDA 2,876,546 Total $415,775,002
LA County’s Redevelopment Agencies 2011 Required Transfers (Source: CA DOF)
yield tax revenues and jobs
turbulent and cities left to fend for themselves
state credit issues
Montebello is Not Alone
14
Media Coverage Has Impacted Montebello’s Financing Strategy
15
Date Headline Feb 19: Fiscal Mess Fuels Crisis in Montebello Feb 22: D.A.'s Office opens inquiry into off-the-books bank accounts in Montebello Feb 24: Montebello Seeks Missing Bank Accounts Mar 10: Solution nears in mystery of off-the-books $1 million account in Montebello Mar 31: Montebello May Have Trouble Making Payroll, Paying Bills Apr 22: California Orders Audit of Montebello Finances Apr 22: Montebello officials consult bankruptcy attorneys Apr 23: Montebello May Face Insolvency if it Doesn’t Close Budget Deficit Apr 28: Federal housing department freezes Montebello funds Apr 28: Montebello to subpoena suspect bank records; HUD suspends funding to city because of violations Apr 29: Public corruption prosecutors launch criminal investigation of Montebello bank accounts May 5: Troubled Montebello’s Bonds Downgraded to Junk Status May 14: Special Report: Montebello uses financial maneuver to help repay $17M loan from its redevelopment agency Jun 19: HUD auditing Montebello over use of federal dollars Jun 30: FBI is Investigating Montebello’s Finances
Turnaround imperative…and they have acted swiftly and definitely
Administrator/Turnaround Specialist and FirstSouthwest as Fin. Advisor
A Tough Time to be in A Tough Spot
16
17 17
Financial Recovery Plan
18
19 19
Financial Recovery Plan (“Financing Package”): Steps to Recovery
Buckets of Opportunity
Oil Levy Costco Etc.
Buckets of Peril
State Audit RDA Loan HUD Etc.
Step 1
Step 2
Step 3
Step 4
Step 5
20 20
Guiding Financial Principles
“Big 5” Financial Principles
21 21
Budget & Cash Flow Summary (2011-2012)1
Estimated Revenues for FY 2011/12 43,800,000 Expenditure Limit for FY 2011/12 (42,800,000) Net Positive Cash Flow 1,000,000 Estimated Beginning General Fund Cash Balance FY 2011/12 7,014,000 Financial Imbalance to be Addressed2 (2,671,902) Balancing Requirements3 2,671,902 Estimated Ending General Fund Cash Balance FY 2011/12 7,014,000
1 All figures approximate, subject to change 2 Includes Projected Deficits in General Fund, Golf Course Fund and Detention Center Fund 3 Includes Continuation of Employee Concessions (CalPERS), Extension of Oil Extraction Levy, Est. Misc.
Employee Furloughs, User Fee Update, Animal License Fee Update, Successful Cash Flow Borrowing
July 1 Sept/Oct Dec. $ June 30
22 22
Timing of Cash Flow
Cash Flow Dry Period Positive Cash Flow Period
23 23
Recovery Plan: Key Terms & Definitions
Credit Rating: Short Term Borrowing will be a Private Placement
articles and reported events (rumors of bankruptcy, HUD Audit/FBI, etc.) “Buckets of Peril”:
“Buckets of Opportunity”:
24 24
Buckets of Peril (partial)
State Audit Findings / Corrections RDA Loan Balance Due HUD/HOME Issues Self Insurance Fund Hilton Hotel Management Fee State Controller On- going Audit May Require Some Adjustments / Repayments General Fund to Repay Loan by June 30, 2011 Final Audit Findings Due Soon for HUD/HOME Funds Need to Replenish Self Insurance Fund Reserve Management Fees Possible Due to Hilton Operator
TBD
COMPLETED - $0
$0 - $4M
$1 - $8M
Up to $4.5M Downside:
Flow Downside:
Short-Term GF Cash Flow
Downside:
Cash Flow
Litigation Against 3rd Parties Downside:
Flow
be Paid Downside:
Flow Upside:
Repayment Terms
Corrections
Principles Supports Corrections Upside:
for Repayment
Borrowing May Be Possible Upside:
Adjustments by Corrections
Repayment Terms
Recovery from 3rd Parties Upside:
Payment of Possible Claims
Reserves Over Time Upside:
to Adjustment
Be Available to Pay Portion of Amount Due
Payment Terms
25 25
Buckets of Opportunity (partial)
Opportunity Value Timeframe Update of User Fees & Charges Adopt pending updated User Fees & Charges to ensure cost recovery $435,000-575,000 per year Short Term Voluntary Extension
Continue Current Oil Production Levy Past 12/31/2011 $1,000,000 per year Short Term (by Dec 2011) Costco Fuel Center Facilitate development of Costco Fuel Center with lease purchase to retain Costco $110,000-250,000 per year plus lease value (over $1,000,000) Short Term Property Sale Sale of City owned sites
Short Term Reinvigorate Assets Review Options for Water System, Golf Course and other assets $1,500,000 + Short to Mid Term Enhanced / Additional Retail Centers Work with property owners to expand & retain sales tax TBD Mid to Long Term (2 to 5 years) Montebello Hills Site Potential to add rooftops and/or retail to enhance retail demand and expand retail base TBD Mid to Long Term Infill Development Pursue development of infill sites TBD Mid to Long Term Sit-Down Restaurants Development of in-fill sites and in existing shopping centers $15,000 to $40,000 per restaurant per year Mid to Long Term Short Term: Within 2011/2012 fiscal year – Mid Term: Up to 24 months – Long Term: 25 months or more
26 26
Capital Markets Schedule
June Adopt 11/12 Budget Certify 10/11 Budget Adopt Fiscal Plan
July / August Confirm Employee Concessions Complete Financing Package Shop Financing Package Due Diligence Activities Execute Liquidity Transactions September Due Diligence Activities Initial Term Sheets City Council / Community Review
October Close Funding Transactions (~$5M to 8M)
7/1 Cash Flow Balance = $7.0M
Note: Assumes $4.0M per month City spending; All figures approximate
8/1 Cash Flow Balance = $3.0M
$6.0M 9/1 Cash Flow Balance = $2.0M 10/31 Cash Flow Balance = ~$3.0 to 6.0M (if successful)
27 27
TRAN Financing- Next Steps
August - October: a) Complete Financing Package and Shop Financing b) Brief Community and Gain City Council Approvals c) Secure Short Term Tax Revenue Anticipation Note Buyers d) Complete Documentation of Short-Term Financing
28 28
29 29
CITIES TARGET REAL ESTATE FOR ECONOMIC DEVELOPMENT
increment from “RDA”
Montebello has used Redevelopment as primary tool to grow new jobs and taxes Must now expand Economic Development programs
Tools for Economic Development
30 30
Montebello’s Accomplishments since May
(w/ $1 million in reserves) and Guiding Financial Principles
– Eliminated debt obligation between RDA and City (payment made prior to June 30) – HUD/CDBG Audit--timely response, Action Plan development, and initial execution of Action Plan – Proactive meeting and follow-up with Bond Insurer (NPFG) – Positive meeting and continued follow-up with Union Bank on letters of credit – Updated and improved response to Federal Transportation Administration review – Resolved outstanding bank accounts and rumors/claims of mysterious activity – Working with City Attorney’s office to actively track and resolve outstanding litigation
31 31
Montebello’s Accomplishments since May
It is imperative for capital markets community to acknowledge progress
– Updates to user fees and charges approved by City Council in June – Opened discussions with Costco on lease renewal and/or purchase options – Negotiation of a two-year extension of oil extraction levy – Economic Development projects list created and consultant panel selected
– Retained Kosmont as Interim CA and Financial Turn-around specialist – Retained First Southwest as Financial Advisor to support Finance Director’s efforts on turnaround activity – Hired underwriter/placement agent De La Rosa & Co. to work with to market Tax and Revenue Anticipation Note (TRAN) financing (currently in due diligence and documentation preparation phase, and expected to close prior to Q4 2011)
What Holds Montebello Back
community remains nervous
double payments” are not true/accurate, yet damage is done
bad decisions and deficient administrative processes
financial turnaround (efforts to secure cost effective credit impacted)
negative stories while Montebello seeks its TRAN financing
32
What Keeps Montebello’s Hopes Alive
– Deficient processes and aging accounting/reporting systems – YES – Administrative mishaps and sloppy records - YES – Can these be fixed? – YES (in process but will take time)
there is a sense that the “jewel” can restore its luster
strong retail and residential demand
be restored to higher quality levels with Financial Recovery Plan
in play
33
34 34 Week of Activities May 4 Moody’s Credit Rating Assigned to Series 2000 COPs – Downgraded two notches to Ba1 (negative outlook) May 4 City hires FirstSouthwest as financial advisors (Approved 3-1; Cortez – NO) May 11 City hires Kosmont Companies as Interim City Administrator/ Financial Turnaround Specialist (Approved 4-1; Cortez – NO) May/June Kosmont Pursues Reconstruction of City budget and finances/initiates FRP June 1 Introduction of Financial Recovery Plan Components & Preliminary Schedule June 8 Community Primer – Detailed Introduction on the Budget Process & the FRP/Financial guidelines – Received and filed by City Council (Approved 4-1; Cortez – NO) June 15 Council and Community briefing of 2011/12 Budget & FRP discussion; Adoption of final 2010/2011 City and RDA Budget (Approved 4-1; Cortez – NO) June 22 Adoption of final 2011/2012 Budget, Financial Guidelines, Fee resolutions; FRP authorization (Approved 4-1; Cortez – NO) July 13 City retains Investment Banking firm De La Rosa & Co. (Approved 4-1; Cortez – NO) August 24 City Council review of short term TRAN Financing Package (Approval is Anticipated))
Montebello’s Road to Financial Recovery: City Council Action Plan
35 35
securing qualified permanent City Administrator
tool for economic development. If lawsuit filed by CRA/League prevails would likely benefit Montebello's recovery.
brave and prudent steps.
Life After Short Term Financing?
36