
SLIDE 1
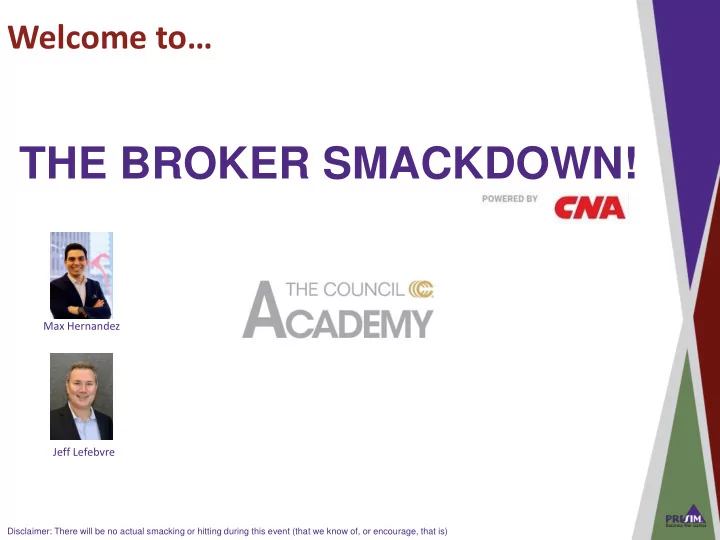
Welcome to…
THE BROKER SMACKDOWN!
Disclaimer: There will be no actual smacking or hitting during this event (that we know of, or encourage, that is)
Max Hernandez Jeff Lefebvre
THE BROKER SMACKDOWN! Max Hernandez Jeff Lefebvre Disclaimer: - - PowerPoint PPT Presentation
Welcome to THE BROKER SMACKDOWN! Max Hernandez Jeff Lefebvre Disclaimer: There will be no actual smacking or hitting during this event (that we know of, or encourage, that is) The Process Break up into separate management teams Each team
Disclaimer: There will be no actual smacking or hitting during this event (that we know of, or encourage, that is)
Max Hernandez Jeff Lefebvre
Methodology
You run a business (active, not
passive learning – a “laboratory”)
Total immersion (overwhelmed
with data. A representation of reality, not a replication)
By doing it! (making mistakes) Focus on the bigger picture (get
to others, listen to others)
As an organized team
(divide/conquer/report)
Competing (focusing on end-
goals)
Fun!
An opportunity to share thoughts & best practices in real-time Common “Blind Spots” & Thinking Points
1.
About the “whole” picture of Agency/Brokerage operations and the need for coordinated/aligned decision- making
2.
About how you make money (i.e., financial reports, metrics)
3.
About long-term positioning (i.e., strategy)
4.
About the need for management & leadership
value
(i.e. markets, competitors)
teams/multiple perspectives/dialogue/debate
10 lbs in 5 lb bag Outcome: Improved Decision-Making
Customer Satisfaction Financial Performance
Competitive Analysis ► Source/COI Analysis ► Analytics: Customer Analysis ► Financial Management► Source/COI Management► Staffing & Sales Management► Customer Management► P&C Carrier & Markets Management► Profitability Analysis ► Production Analysis ► Portfolio Analysis ►
Metric or KPI Circle Weighting Circle
Net Revenues Avg. Final Net Profit € Avg. >=12.5% Net Profit % (ROS) Avg. >=12.5% Net Profit Final % or € Return on Investment Avg. Final ROA or ROE (if final ROE is chosen an equal or higher
weighting must be in average profit)
Customer Experience
NOTE: All customers, weighted by customer count.
Avg. Final Customer Satisfaction Index (CSI) or Lifetime Value (LTV) Producer Attrition Avg. Final 100%
Using the KPIs below, document how you want your company’s performance to be assessed. Rules:
attrition CANNOT be higher than 20% in the final round! New rules may be added.
PERFORMANCE MEASUREMENT Team: ________________